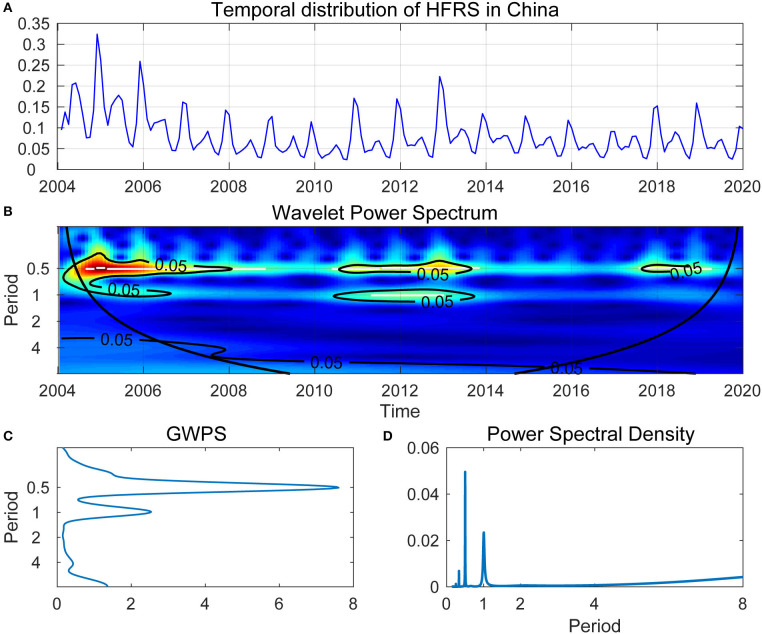
Figure 4.
(A) Temporal distribution of HFRS in China. (B) Wavelet Power Spectrum (WPS) of the reported monthly HFRS outbreaks. The cone of influence was separated by thick black lines, indicating the regions affected by edge effects. The color code for power ranged from blue (low power) to red (high power). The white lines showed the maxima of undulations in the WPS. (C) Global wavelet power spectrum (GWPS) of HFRS outbreak—average wavelet power for each frequency. (D) Fourier power spectral density of HFRS outbreaks, the peaks of power around half a year and 1 year can be observed in (C,D).

