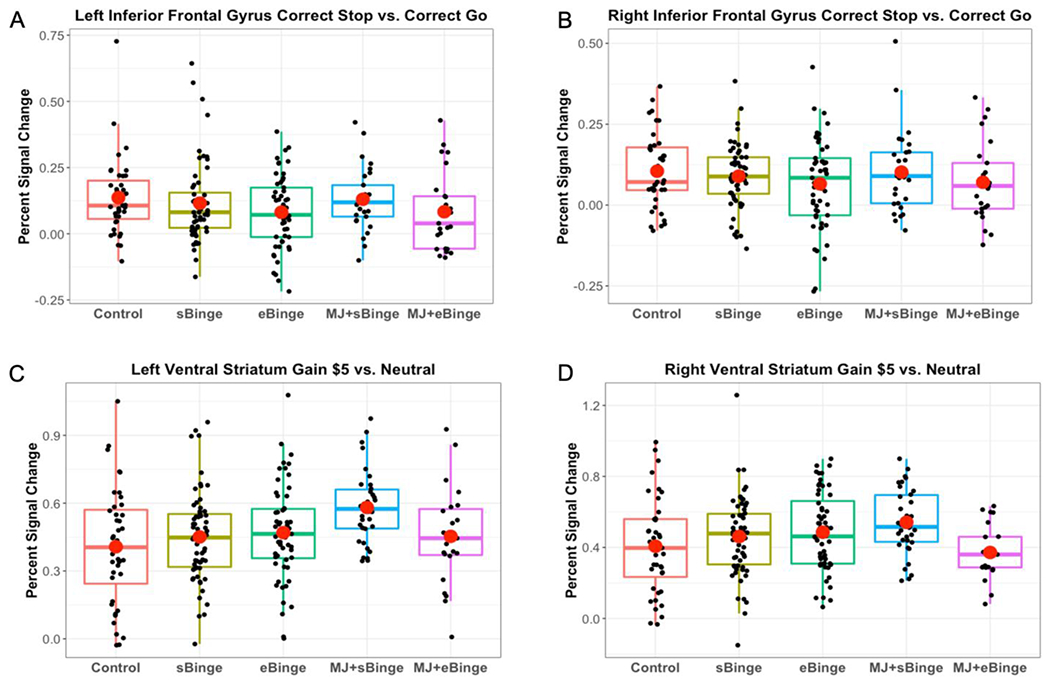
Figure 1.

Regions of interest activation during the Stop Signal Task and the Monetary Incentive Delay task. Left (A) and right (B) Inferior Frontal Gyrus activation in response to Correct Stop relative to Correct Go. Left (C) and right (D) Ventral Striatum activation in response to Gain $5.00 relative to No Gain. Red circles represent group means.
