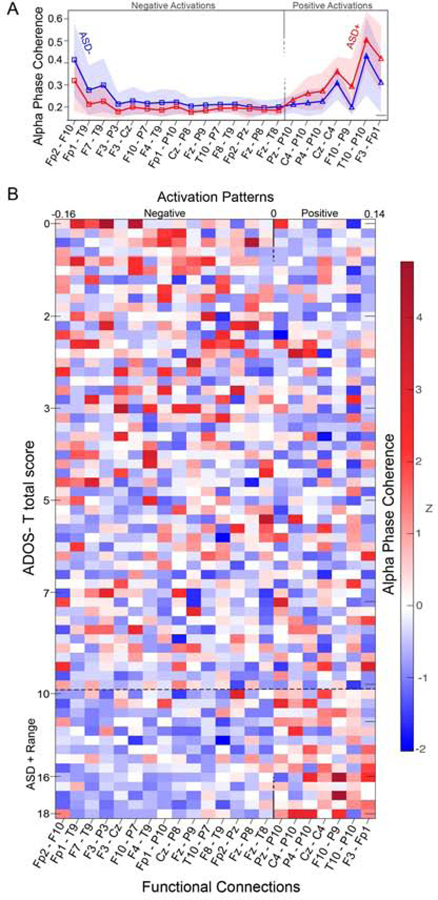
Figure 4.
(A) Mean alpha phase coherence for each of the 22 predictive function connections that defined the consensus feature set for ASD+ (red) and ASD- (blue) groups. Shaded regions represent SD. (B) Individual alpha phase coherence values (z scores) for each participant (arranged from low to high ADOS score) for each predictive function connection (with activation patterns arranged from negative to positive).

