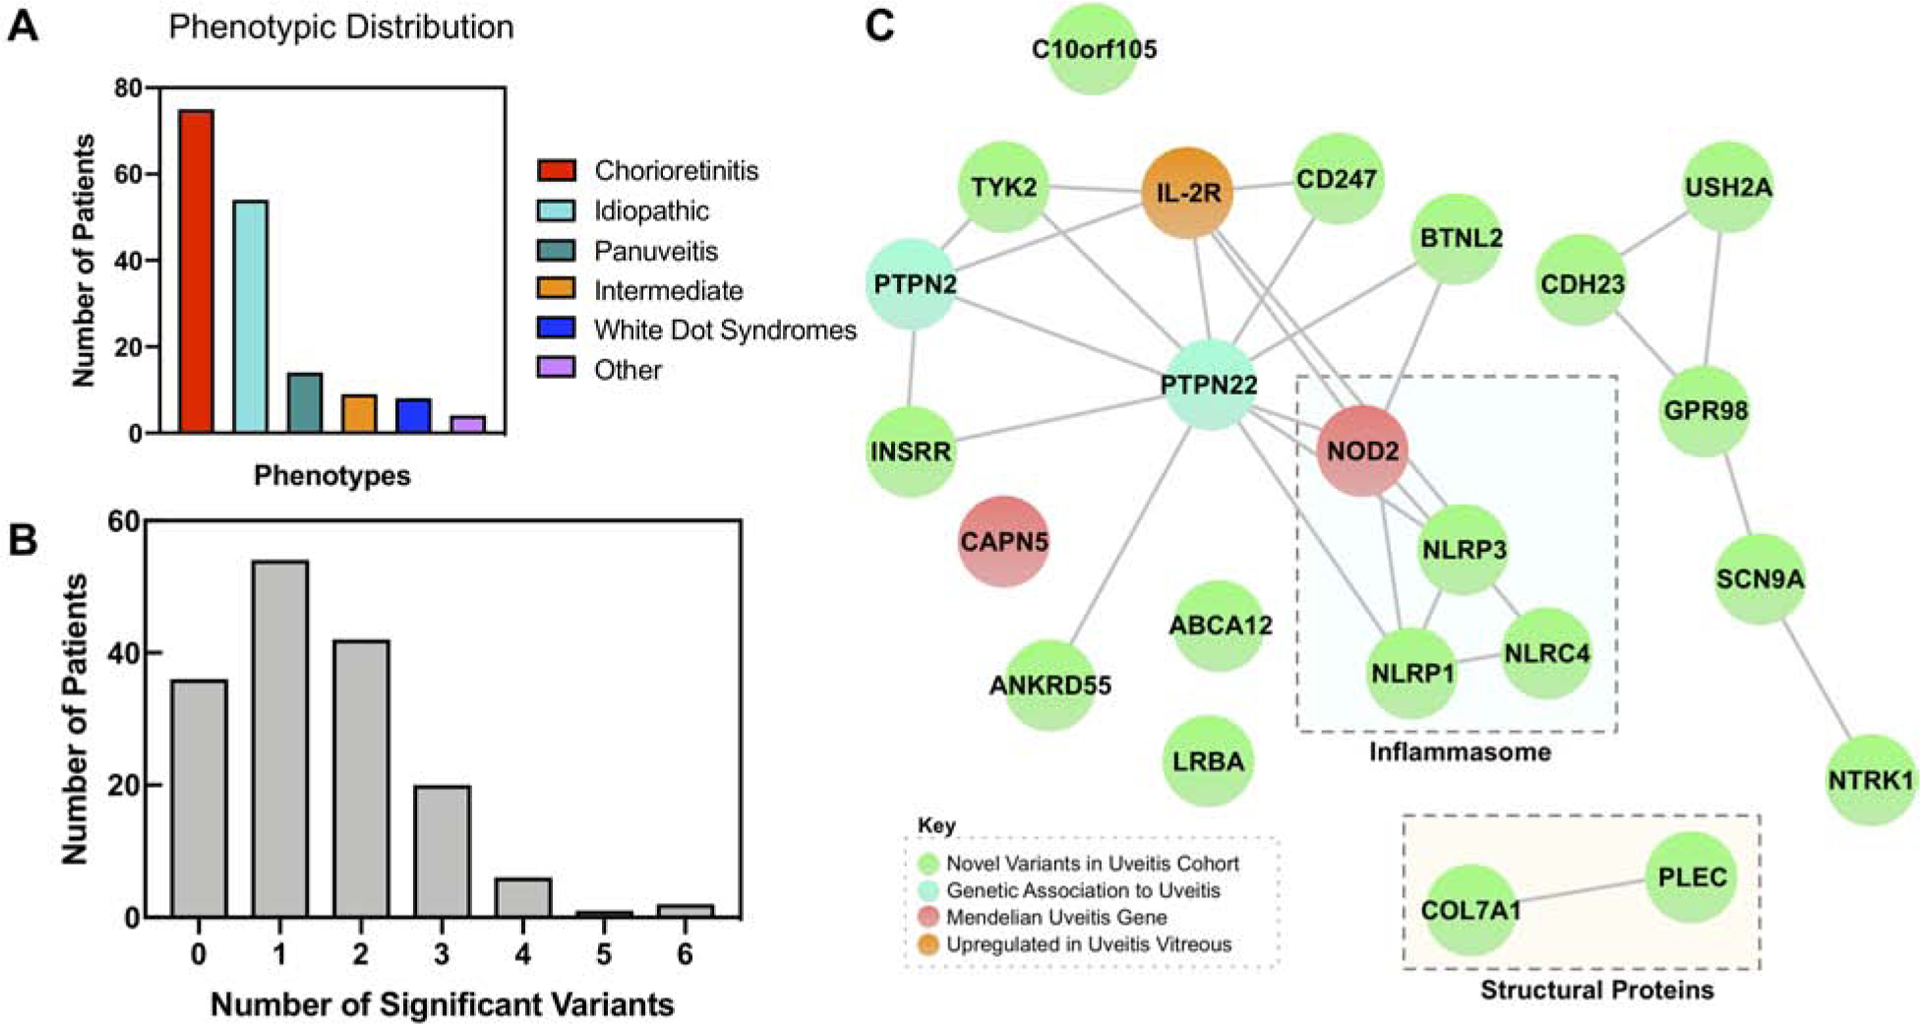
Fig. 2. Network analysis highlights the inflammasome and other clusters of immune signaling genes:

(A) Bar chart highlighting distribution of clinical phenotypes in the uveitis cohort. Uveitis patients were grouped into one of six categories based on their clinical phenotype, including the anatomic location and etiology. ‘Other’ includes cases such as uveitic glaucoma or uveitis after retinal tear. (B) Distribution of number of significant variants per patient. Histogram showing the number of significant variants per patient. Significant variants refer to the 203 variants in the 23 genes that were ranked to prioritize disease causing alleles and weighted based on the number of variants in that gene. The distribution has a mean of 1.49 and a standard deviation of 1.22. (C) A StringDB query was run on the 23 most prioritized genes from the exome analysis, resulting in this network. It demonstrated close relationships between members of the NLR inflammasome (NOD2, NLRP3, NLRP1, and NLRC4). In addition, there were connections between PTPN22 and other immune and signaling molecules, including TYK2 and BTNL2. There were also edges between CDH23, USH2A, GPR98, SCN9A, and NTRK1, and COL7A1 and PLEC. Proteins that did not cluster in the main network included CAPN5, ABCA12, LRBA, and C10orf105. There were nodes corresponding to novel associations to uveitis (green), previously identified genetic associations to uveitis (cyan), Mendelian forms of uveitis (red), and proteins upregulated in uveitis vitreous (orange).
