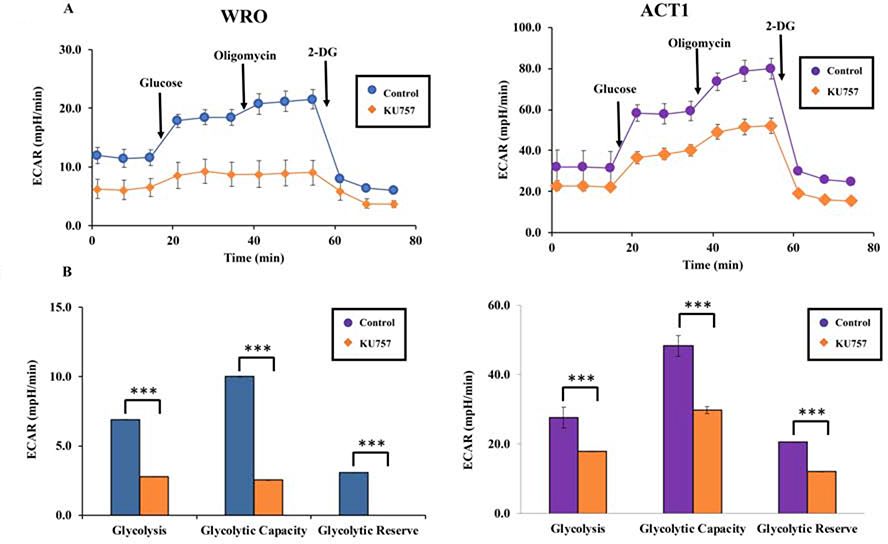
Figure 2A and B.
Treatment of thyroid cancer cells WRO and ACT1with KU757 downregulates glycolysis. Glycolysis stress test was performed using the Seahorse XFe96 analyzer (Figure 2A). The x-axis in Figure 2A represents time since the start of the glycolysis stress test. Glucose was injected at 18 min, oligomycin was injected at 36 min and 2-DG was injected at 54 min. Data from Figure 2A was then used to calculate changes in glycolysis, glycolytic capacity, and glycolytic reserve shown in Figure 2B per the manufacturer protocol (Agilent Technologies) and represented with standard error bars.

