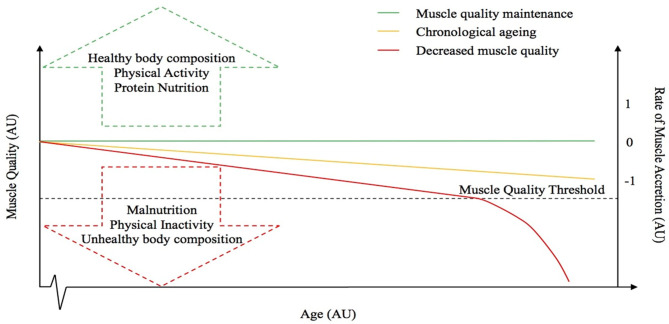
Figure 2.
Hypothetical relationship between muscle quality and the rate of muscle accretion or loss with advancing age. The dotted line represents the “muscle quality threshold” beyond which obesity-induced muscle anabolic resistance results in a precipitous, rapid decline in muscle mass and function. The arrows represent some of the factors that might influence muscle quality. The red line represents a decrease in muscle quality, whereas the green line is representative of muscle quality maintenance and the yellow line depicts the “normal” chronological aging process.

