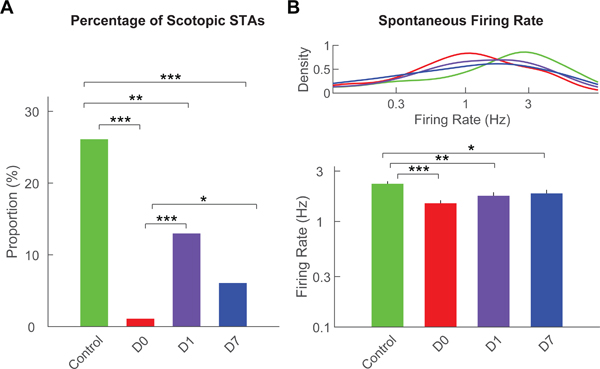
Figure 1. Presence of scotopic STAs and spontaneous firing rates.

(A) Percentage of RGCs that showed scotopic STAs from control eyes (green) or from treated eyes at D0 (red), D1 (purple) and D7 (blue). (B) Kernel density distributions (top) and averages (bottom) of spontaneous firing rates of RGCs from control eyes or from treated eyes at D0, D1 and D7. For all panels: *** = p<0.001; ** = p<0.01; * = p<0.05.
