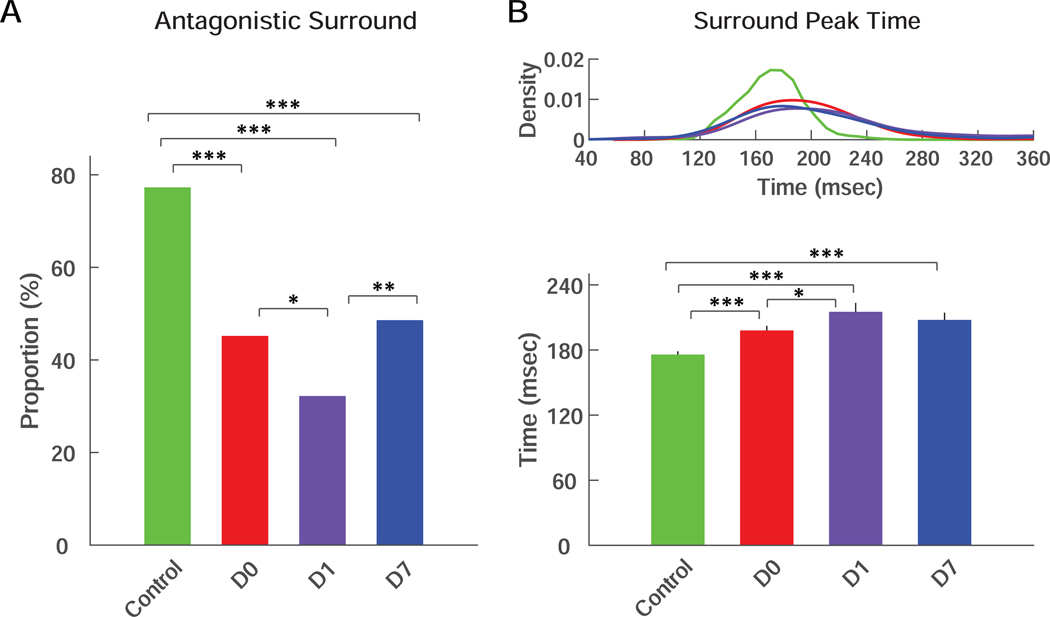
Figure 3. Presence of antagonistic surround and surround STA peak time.
(A) Percentage of the RGCs that showed antagonistic surround in RGCs from control eyes or from treated eyes at D0, D1 and D7. (B) Kernel density distributions (top) and averages (bottom) of surround STA peak time of RGCs from control eyes or from treated eyes at D0, D1 and D7. Only the RGCs that preserved their antagonistic surround were included. Color scheme is the same as in Figure 1. For all panels: *** = p<0.001; ** = p<0.01; * = p<0.05.

