
Figure 1.
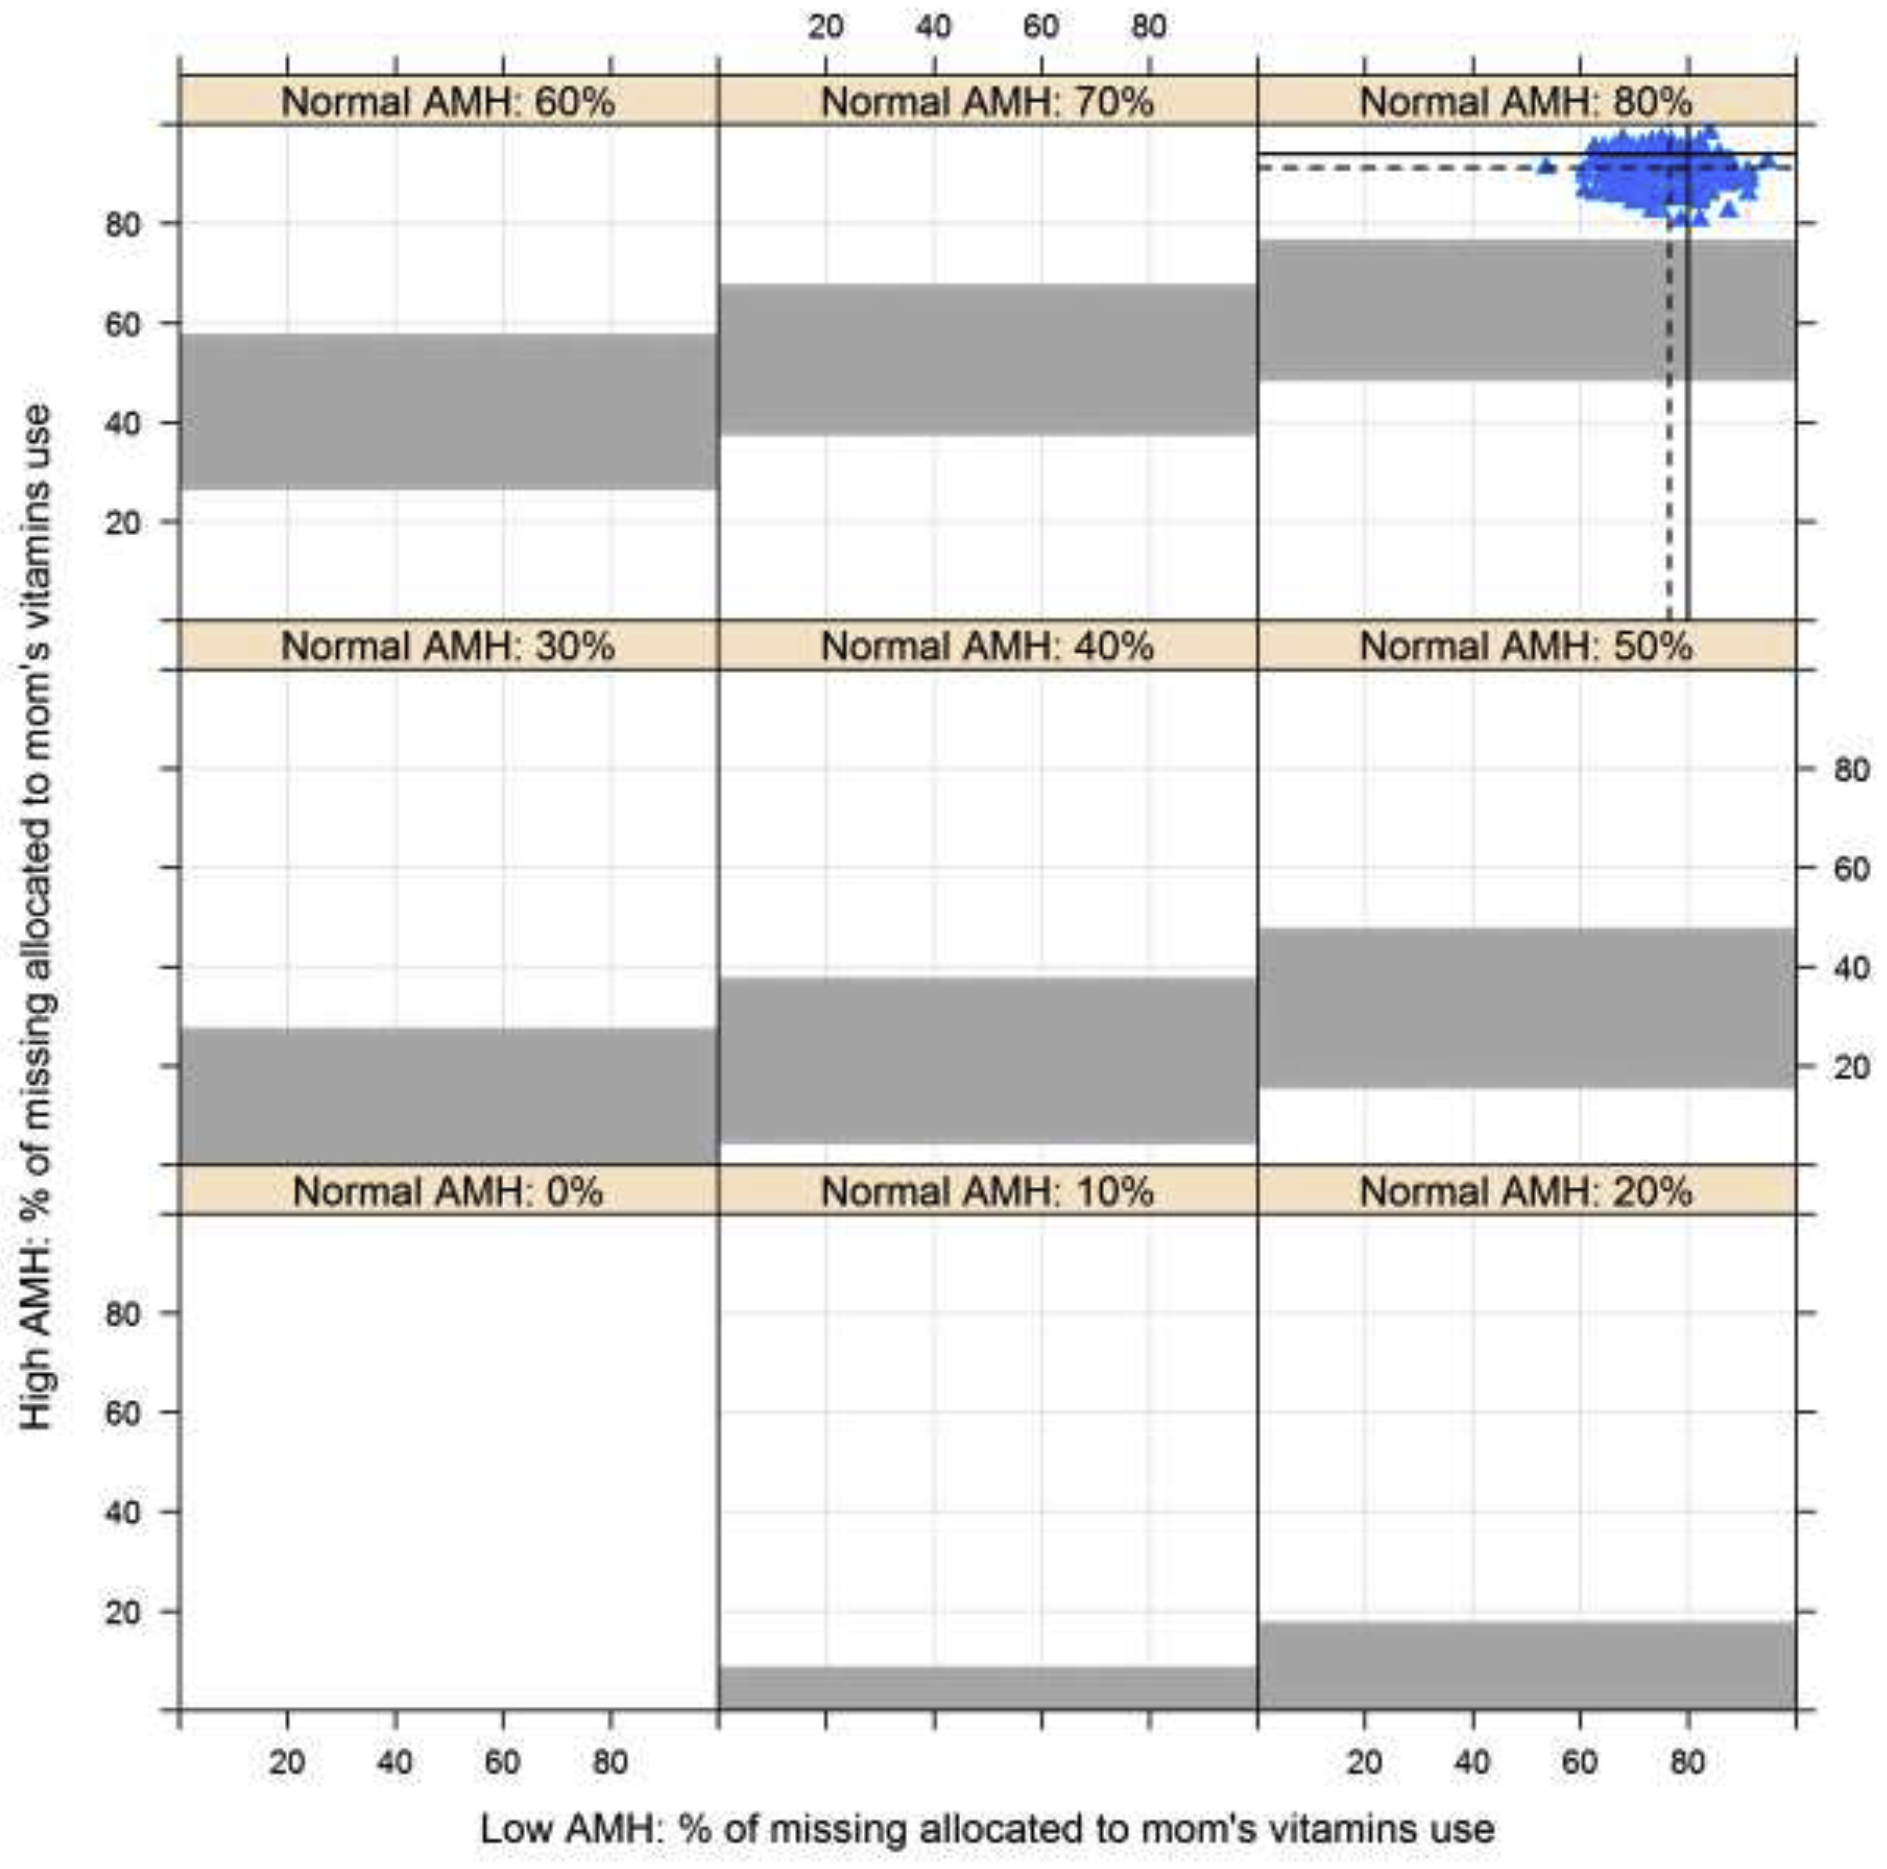
Association between in utero exposures to vitamin use and risk of high AMH compared to normal AMH with missing exposure information imputed across the range of possible scenarios (0–100% exposed in the low and high AMH categories by varying exposure in the normal AMH category). White and grey regions indicate p≤0.05 and p>0.05, respectively. Values from multiple imputation with 1000 datasets are indicated using the blue triangles. Dashed lines represent the mean of the imputed values and solid lines indicated the observed proportions.