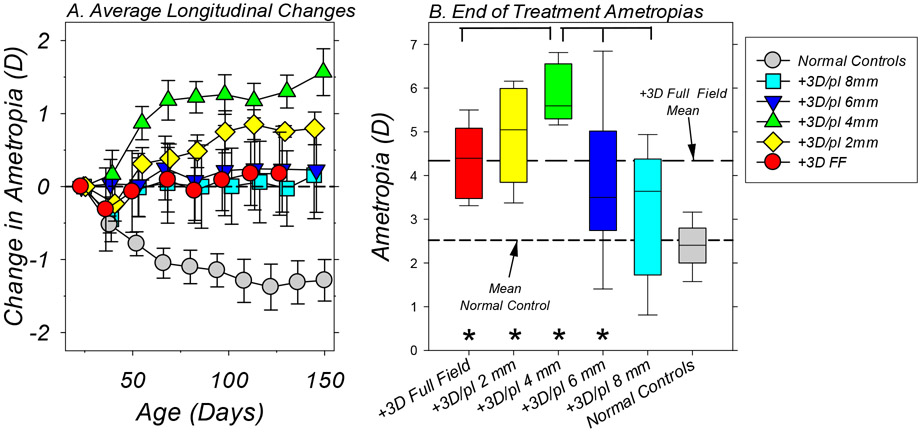
Figure 3.
A. Average (±SEM) binocular change in refractive error from baseline values plotted as a function of age for each subject group. The symbol legend in the figure indicates the color/shading for the different groups. The first symbols in each function represent the start of treatment. B. Box plots of the refractive errors obtained at the end of the lens-rearing period for each treatment group. The horizontal line in each box represents the group median; the lower and upper box boundaries indicate the 25% and 75% limits, respectively; and the lower and upper error bars show the 10% and 90% limits, respectively. The long and short dashed lines represent the mean ametropias for the +3D FF controls and the normal monkeys, respectively, at ages corresponding to the end of the treatment period. The asterisks indicate treated-group refractive errors that were significantly different from that for the normal control monkeys. The horizontal brackets indicate significant differences in the average refractive errors between the 4mm treatment group and other lens-reared groups.

