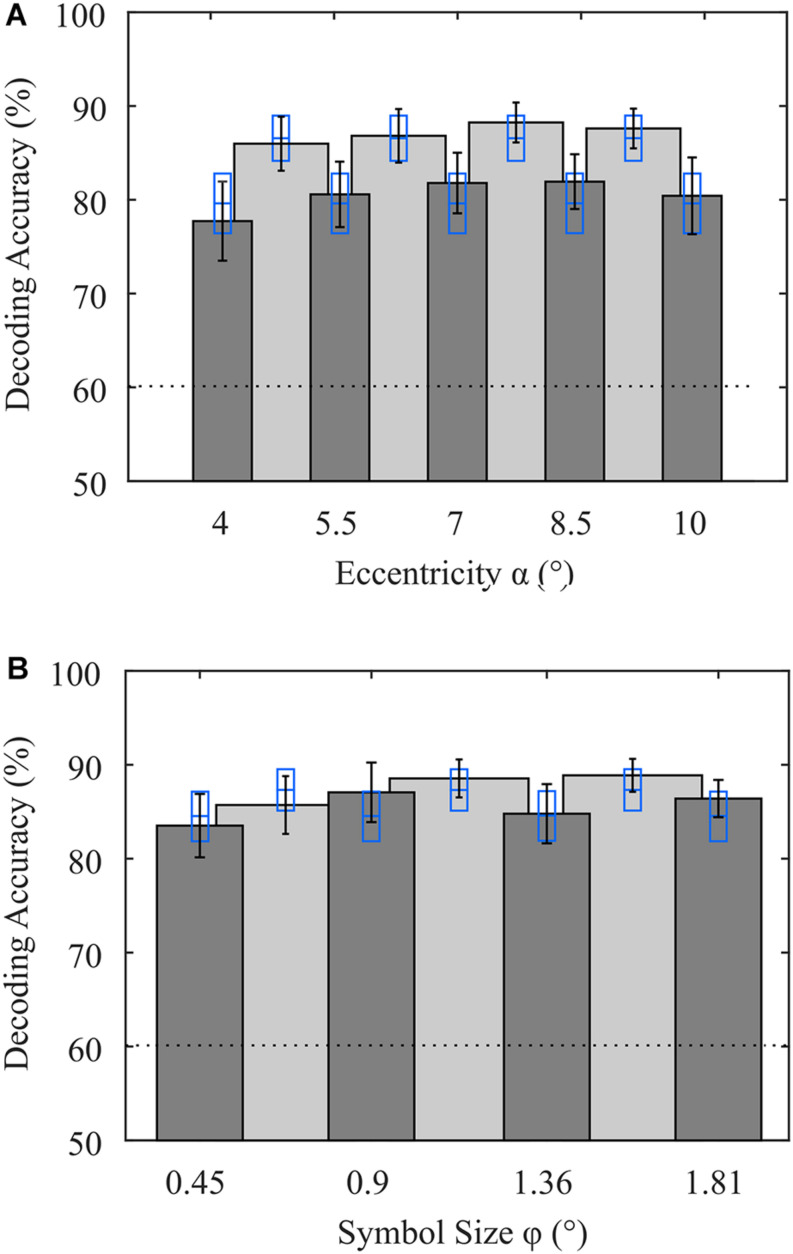
FIGURE 4.
Average decoding accuracies achieved with variations in stimulus features (A) eccentricity and (B) symbol size. Dark gray bars indicate that only trials with that parameter (eccentricity or symbol size) were included in the analysis, but the other parameter varied (symbol size or eccentricity). Light gray bars indicate that in the analysis, trials associated with the two adjacent visual angles were included (e.g., 4° and 5.5°). Error bars indicate the standard error of the mean. Blue rectangles indicate the mean and the standard error of accuracies achieved with all stimulus features involved but sample sizes of the training data sets matched. The dotted line denotes the upper bound of the guessing level, as determined using a permutation test.

