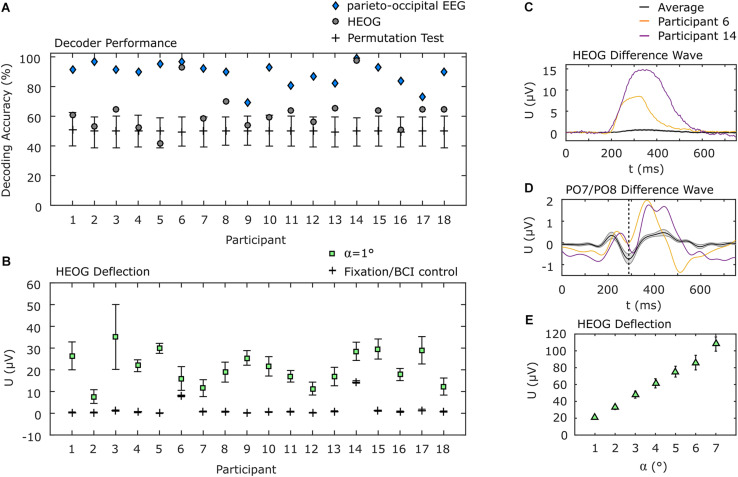
FIGURE 5.
EOG analysis. (A) Individual decoding accuracies achieved with EOG and with parieto-occipital EEG. EOG decoding accuracies for participants 6 and 14 were above 90% but below those achieved using EEG. Error bars indicate the 95% confidence interval of a permutation test. (B) Individual horizontal EOG deflections. Here the same two participants also show higher deflections during BCI use, but they are still below the deflection measured when 1° movements were requested in a calibration procedure. All other participants show almost no deflections during BCI use. (C) EOG difference wave between left and right target presentation. Participants 6 and 14 show considerably higher EOG deflection compared to the average. (D) PO7/PO8 difference wave. Participants 6 and 14 show the N2pc component (dashed vertical line), typically evoked during spatial attention shifts, similar to the average but with higher positive deflection afterward. (E) Deflection of the EOG as a function of the angle of gaze shift during EOG calibration. Error bars in (B,E) indicate the standard error of the mean.

