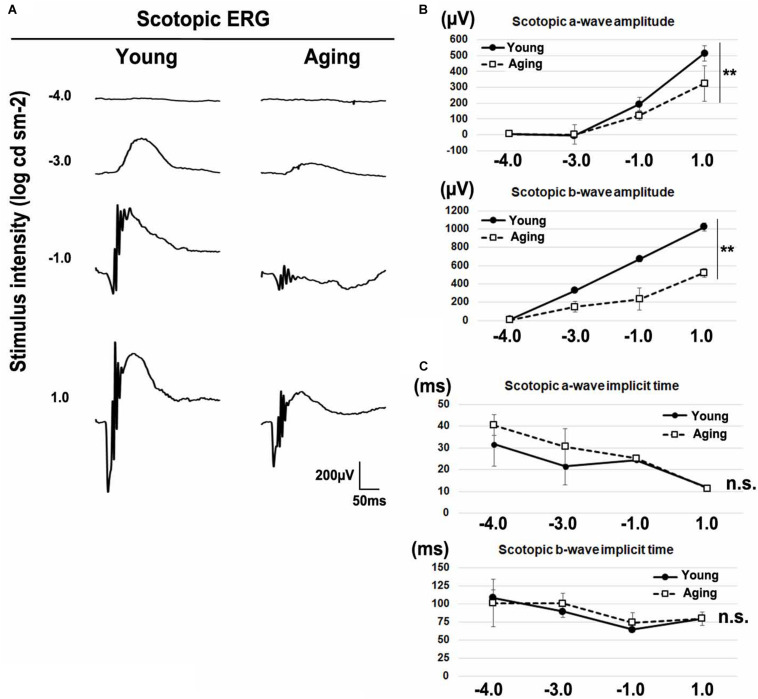
FIGURE 2.
Scotopic ERGs in the aging mice. (A) Representative dark-adapted (scotopic) ERGs in the young adult and aging mice induced by four different stimulus intensities (–4.0, –3.0, –1.0, and 1.0 log cd s/m2). (B) The amplitudes of scotopic a- and b-waves are presented as a function of the stimulus intensity. (C) The implicit times of scotopic a- and b-waves are presented as a function of the stimulus intensity. Error bars, mean ± SD (n = 3 mice). Two-way repeated measures ANOVA (**p < 0.01, n.s., not significant).

