FIGURE 5.
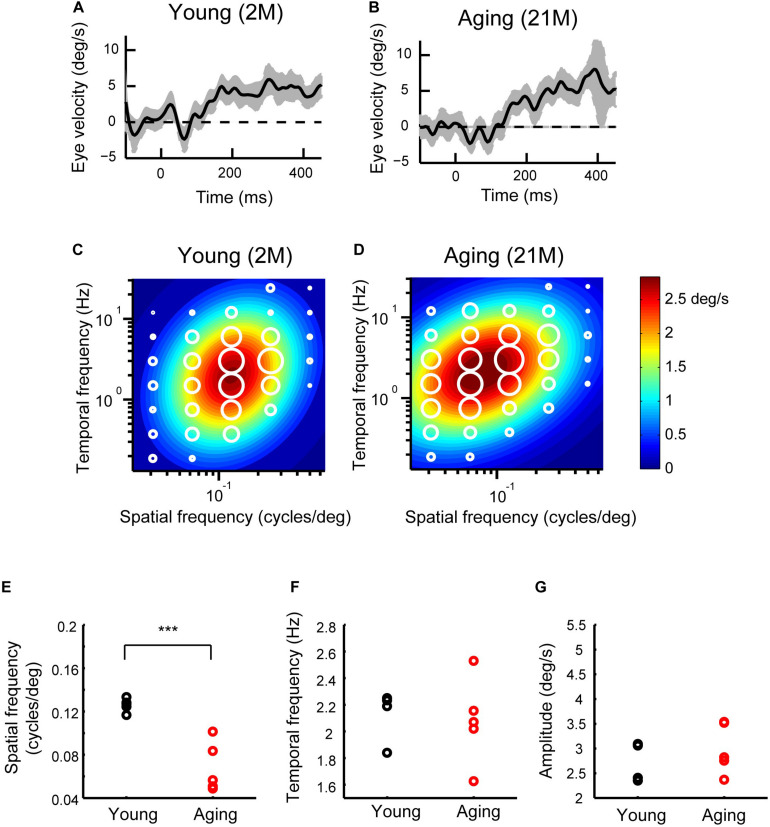
Initial OKRs in the young adult and normal aging mice. (A,B) Eye velocity profiles obtained from a young adult mouse (A) and an aging mouse (B). The eye movements evoked by the visual stimuli of SF = 0.125 cycles/deg; TF = 1.5 Hz. The gray shaded areas indicate the standard deviation of the individual eye velocity (A: 23 trials, B: 27 trials). (C,D) Heat maps of the initial OKRs in the young adult mice (2–3 months old, n = 5) (C) and normal aging mice (21–24 months old, n = 5) (D). Amplitudes of the initial OKRs represented by diameter of the white circles are plotted in the coordinate system of SF and TF. Heat maps indicate the best-fit Gaussian functions. (E–G) Comparisons of the properties of the initial OKRs. The differences in the optimal SF (E), optimal TF (F), and peak amplitudes of the responses (G) are shown individual plot (black dots: young adult, red dots: aging). ***p = 2.2 × 10– 3, Wilcoxon rank-sum test.

