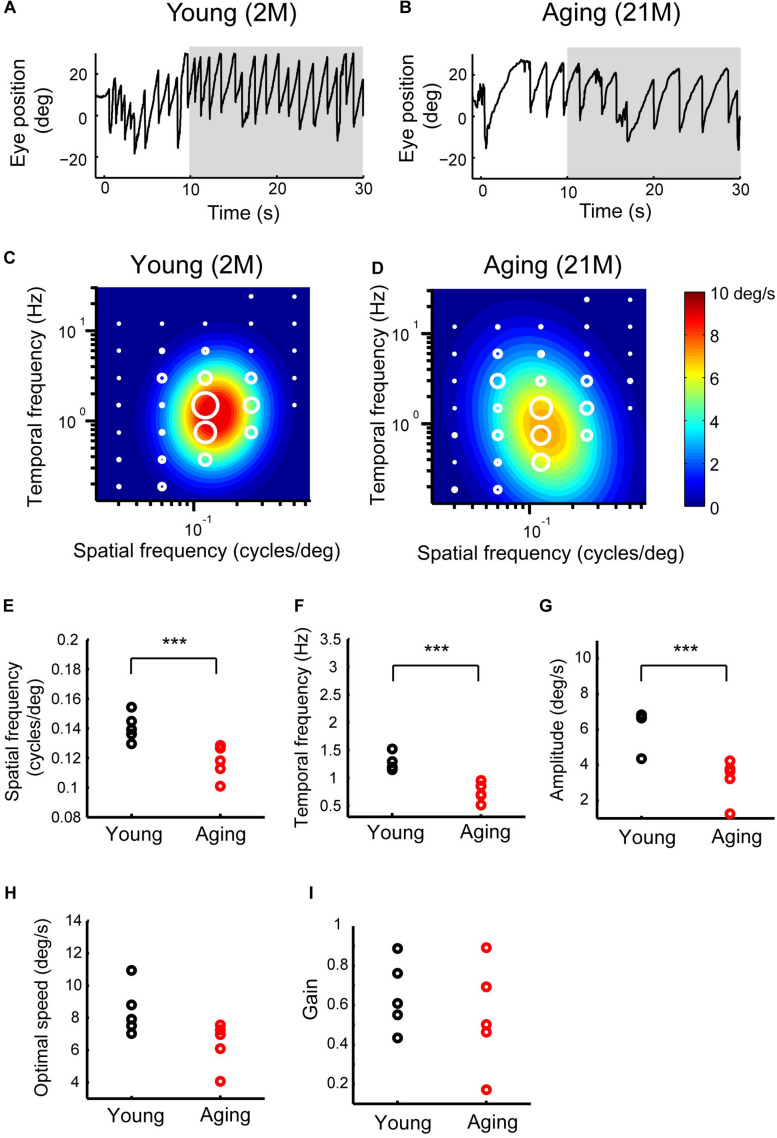
FIGURE 6.
Late OKRs in the young adult and normal aging mice. (A,B) Eye position profiles during OKNs in a young adult mouse (A) and in an aging mouse (B). Mice were exposed against a moving sinusoidal grating patterns (T-N direction spatial frequency 0.125 cycles/deg, temporal frequency 1.5 Hz, contrast 64%) for 30 s. Slow phase eye velocities during 20-s intervals starting 10 s after the onset of visual motion averaged for each stimulus condition (gray shaded area). (C,D) Heat maps of the late OKRs in the young adult mice (2–3 months old, n = 5) (C) and normal aging mice (21–24 months old, n = 5) (D). Mean amplitudes of the slow-phase eye velocity of the late OKRs represented by diameter of the white circles are plotted in the coordinate system of SF and TF. Heat maps indicate the best-fit Gaussian functions (C,D). Comparisons of the properties of the late-phase OKRs. The differences in the optimal SF (E), optimal TF (F), peak amplitudes of the responses (G), stimulus speed at the optimal spatiotemporal frequency (H), and gain at optimal stimuli (I) are shown in individual plots (black dots: young adult, red dots: aging). ***p = 7.9 × 10– 3, Wilcoxon rank-sum test.

