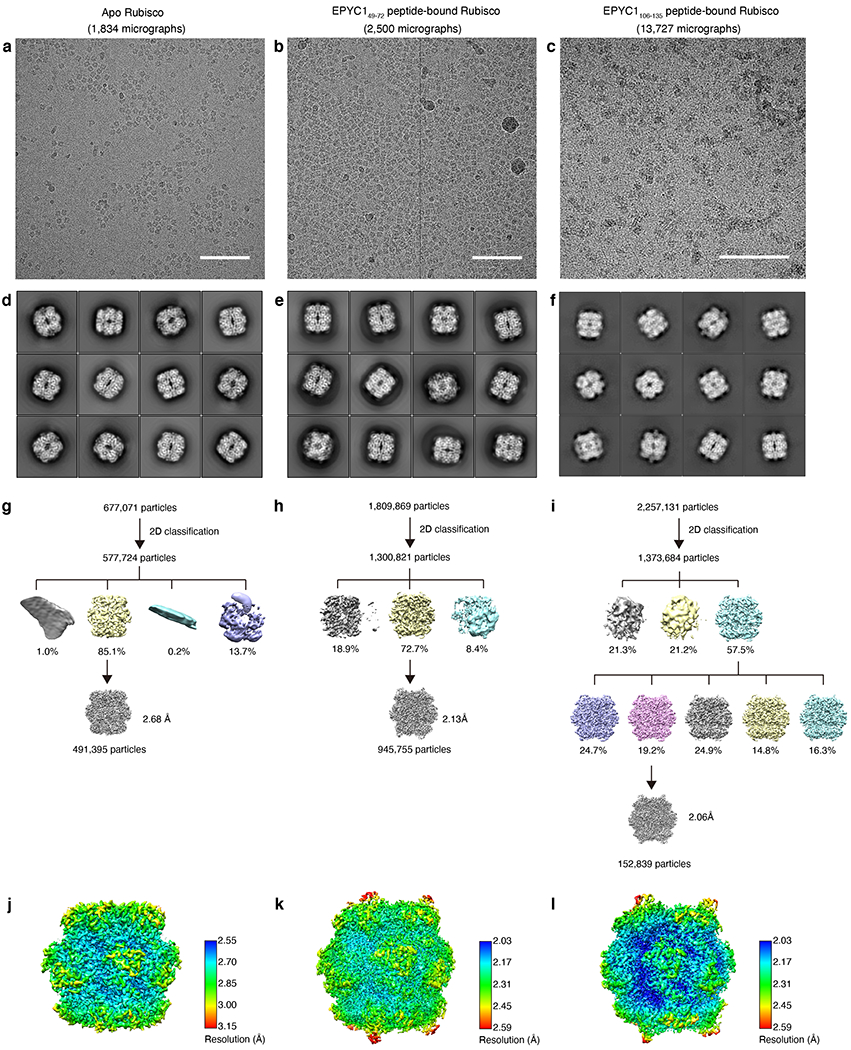
Extended Data Fig. 2. Single-particle cryo-EM data collection and image processing procedure.

a-c, Representative micrographs of the apo Rubisco sample (a), the Rubisco-EPYC149-72 complex (b) and the Rubisco-EPYC1106-135 complex (c). Scale bars = 100 nm. d-f, Representative 2D class averages of the apo Rubisco sample (d), the Rubisco-EPYC149-72 complexes (e) and the Rubisco-EPYC1106-135 complexes (f). g-i, Overview of the workflow for single-particle data processing for the apo Rubisco sample (g), the Rubisco-EPYC149-72 sample (h) and the Rubisco-EPYC1106-135 sample (i). j-l, Local resolution estimation of the final refined apo Rubisco map (j), the final refined Rubisco-EPYC149-72 complex map (k) and the final refined Rubisco-EPYC1106-135 complex map (l).
