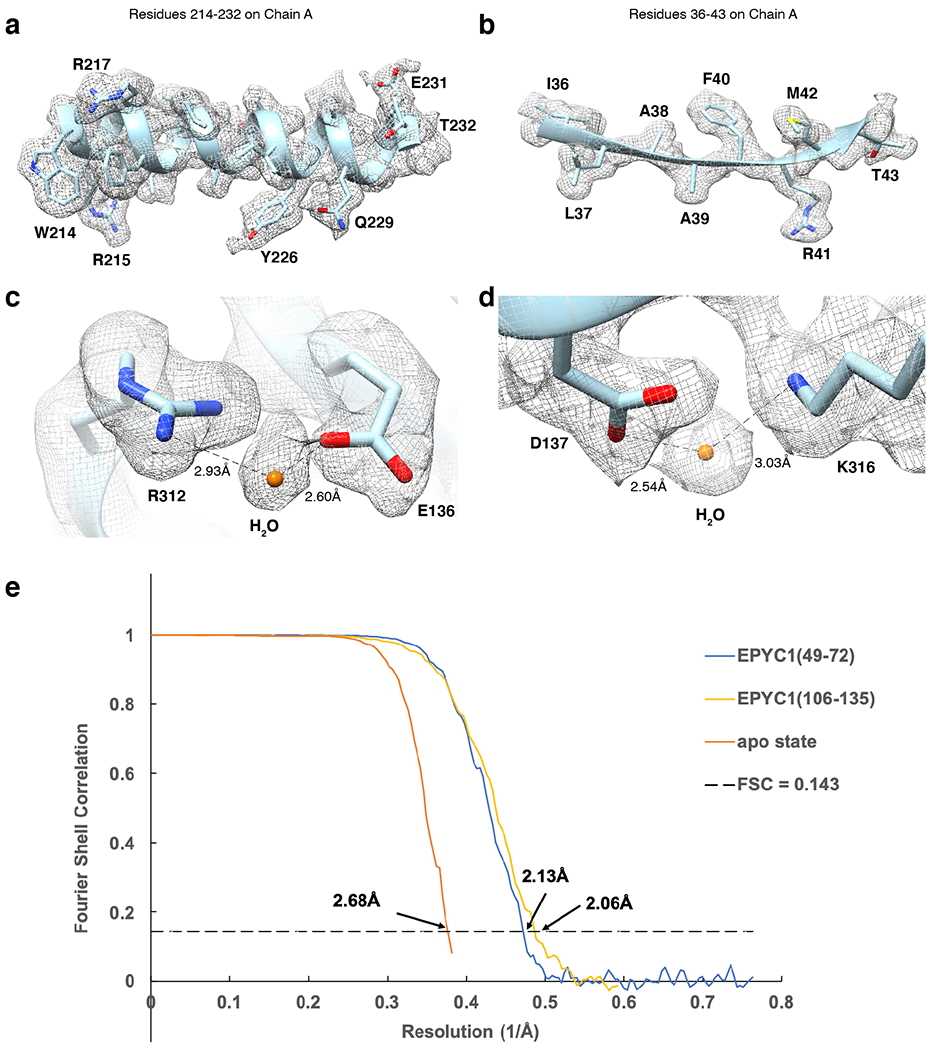
Extended Data Fig. 3. Cryo-EM analysis and resolution of apo Rubisco and Rubisco-EPYC1 peptide complexes in this study.

a-b, Representative cryo-EM density quality showing an α-helix of residues 214-232 in chain A (one of the Rubisco large subunits) (a) and a β-sheet of residues 36-43 in chain A (b) of the Rubisco-EPYC149-72 density map and structural model. The densities are shown as meshwork in gray. The backbones of the structural model are in ribbon representation, and side chains are shown in stick representation. c-d, Representative cryo-EM density quality showing water molecules as orange spheres. One water molecule between R312 and E136 on chain A is shown in panel c, and another water molecule between D137 and K316 on chain A is shown in panel d. e, Fourier shell correlation (FSC) curves of the final density maps of apo Rubisco and the Rubisco-EPYC1 peptide complexes.
