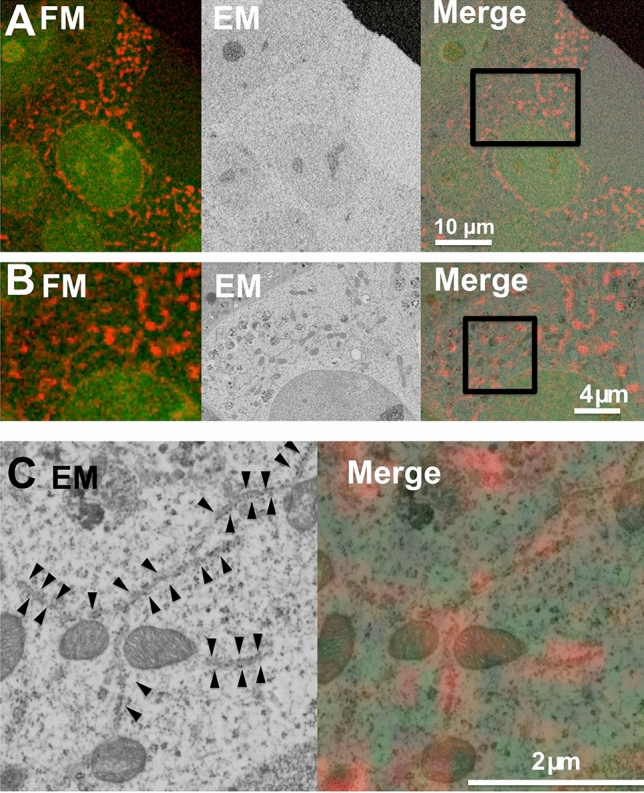
Figure 3.

Two-color in-resin CLEM of nucleus and endoplasmic reticulum was performed using H2B-CoGFPv0 and mCherry2-ER. Thin section (100 nm) of Epon-embedded cells expressing H2B-CoGFPv0 (green pseudo color) and mCherry2-ER (red pseudo color) was prepared. Fluorescent images (FM) and electron microscopic images (EM) were obtained as described in Fig. 2. The “Merge” is a merged image of the fluorescence image (FM) with an electron microscopic image (EM). The images in (B) and (C) indicate magnification of images corresponding to the boxed area in the Merge image in respective (A) and (B). Arrowheads in (C) indicate red fluorescence-positive rough endoplasmic reticulum.
