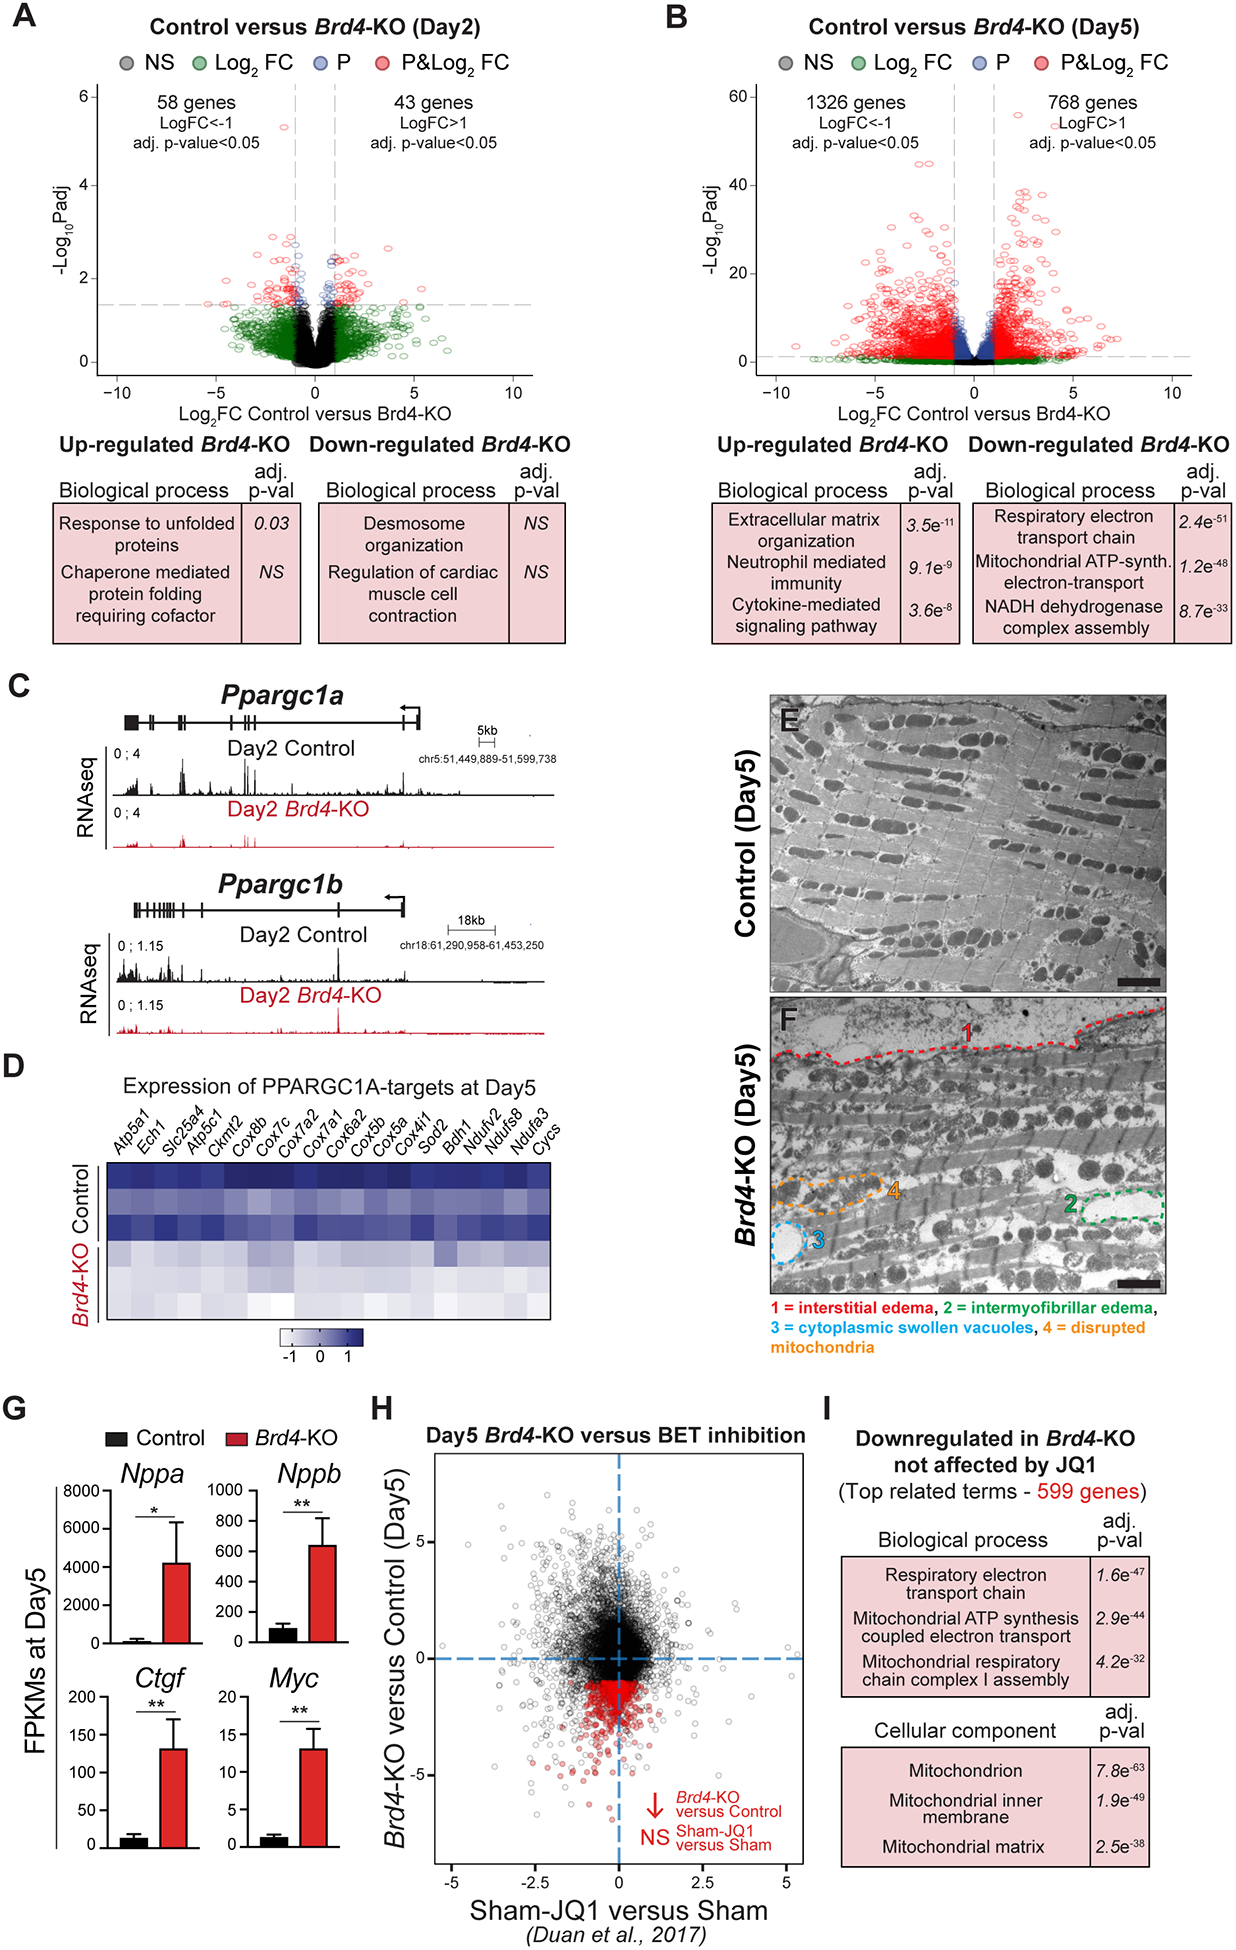
Figure 2: BRD4 regulates mitochondrial metabolic pathways in adult cardiomyocytes.

(A, B) Volcano plots showing Log2 fold change and adj. p-value of individual genes 2 days (A) or 5 days (B) after Brd4 deletion; genes differentially expressed between Cre-control and Control samples have been excluded. Selected categories identified from gene ontology analysis from up or down regulated genes are shown below the volcano plot. Genes are assigned with specific colors following DE analysis: grey (not significant), green (Log2 FC<−1 or >+1), blue (adj. p<0.05) or red (Log2 FC<−1 or >+1 and adj. p<0.05). (C) Track view of Ppargc1a and Ppargc1b genes showing sequencing reads mapping from RNA-seq signature at day 2 post-tamoxifen (TAM) treatment for Control and Brd4-KO samples. (D) Heatmap of expression of PPARGC1A known targets32 in Control and Brd4-KO samples at day 5 post-TAM treatment. (E, F) Electron micrographs of Brd4-KO and Control animals at day 5 highlighting the loss of normal mitochondrial morphology. (G) FPKMs of indicated genes related to cardiac stress and homeostasis in Control (n=3) or Brd4-KO (n=3) cardiomyocytes at day 5. Error bars represent standard deviation (SD). (H) Correlation analysis of difference in gene expression in day 5 Brd4-KO cardiomyocytes compared to sham-operated animals administered JQ1 (normalized to their respective controls). Genes highlighted in red are those which are downregulated upon BRD4 loss but not significantly changed by JQ1. (I) Gene ontology analysis of genes that were downregulated upon BRD4 loss but not affected by JQ1 treatment.
For G, * represents p<0.05; ** represents p<0.01 for indicated comparison.
Scale bars = 2 μm (E, F)
