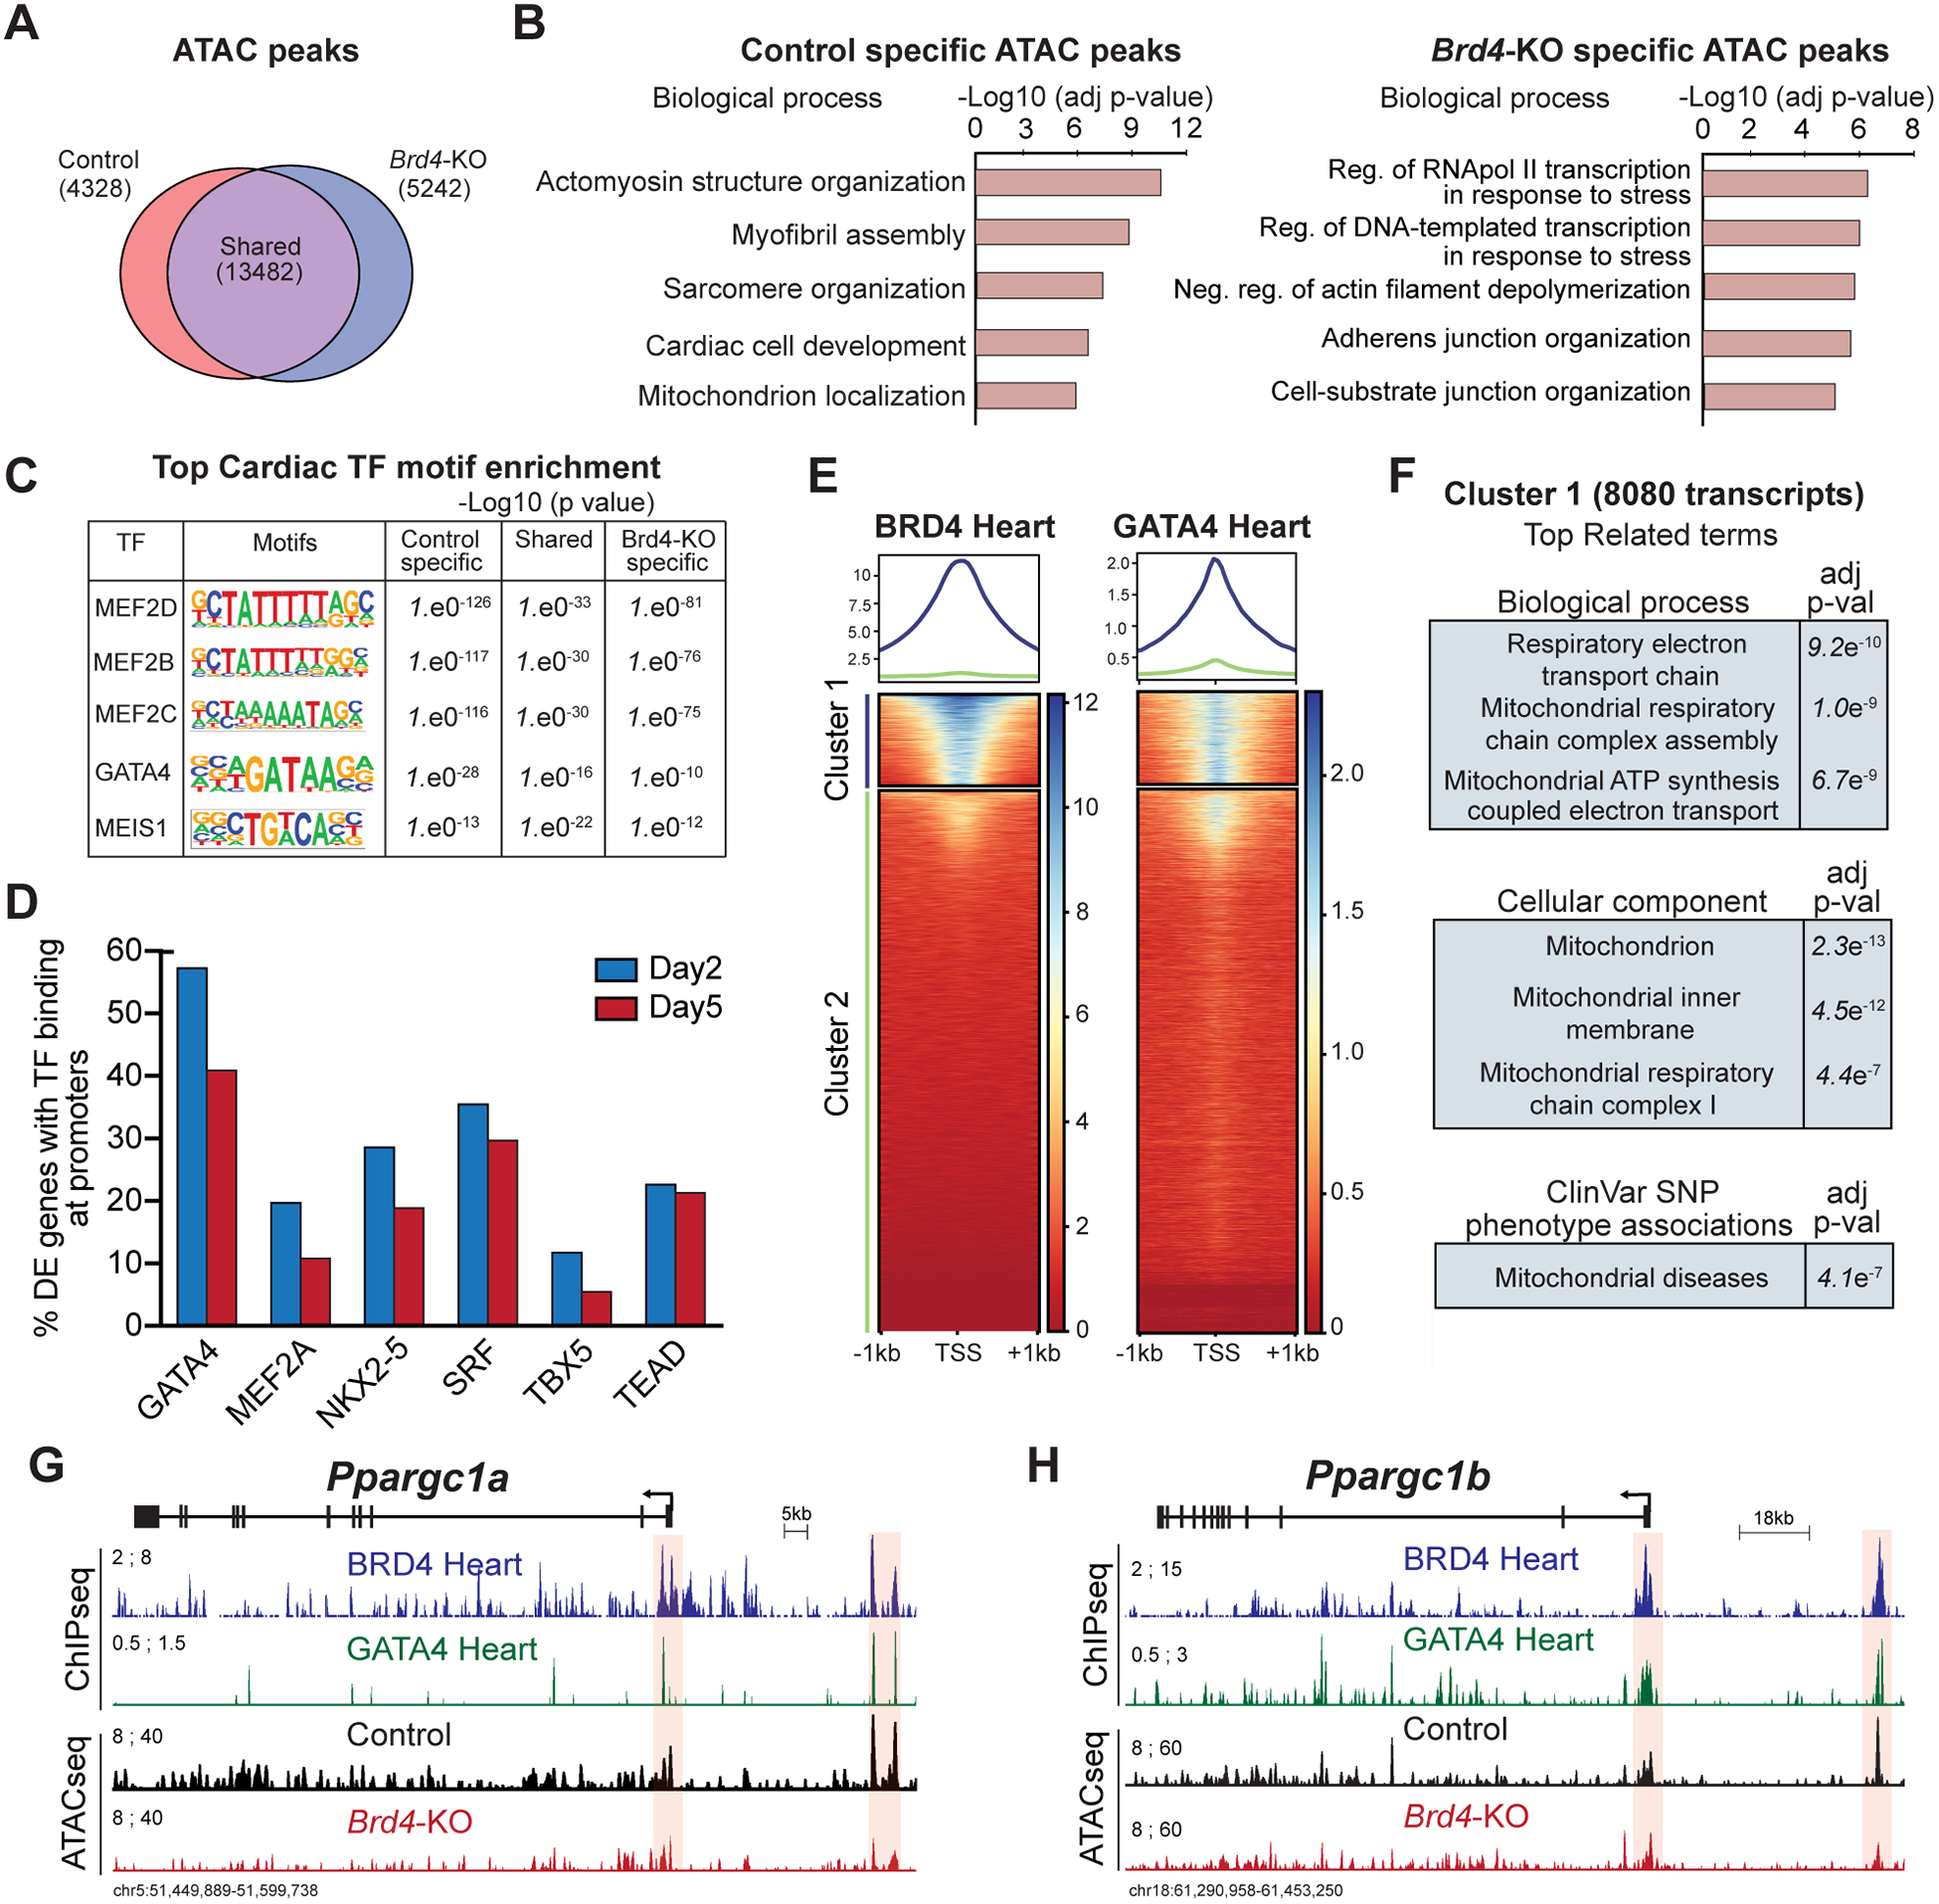
Figure 4: BRD4 and GATA4 co-occupy and regulate genes controlling mitochondrial homeostasis.

(A) Venn diagram showing number of unique and shared accessible chromatin regions between Control and Brd4-KO samples. (B) Top selected categories identified from gene ontology analysis from Control and Brd4-KO specific ATAC regions. (C) Motif enrichment analysis for cardiac TFs in unique and shared accessible chromatin regions between Control and Brd4-KO samples. (D) Number of differentially expressed genes between Control and Brd4-KO at day 2 and day 5 occupied by cardiac TFs40,41 at their promoters (±1 TSS). (E) Heatmaps showing enrichment of BRD4 and GATA4 ChIP signals from adult mouse hearts under basal homeostatic conditions at gene promoters (±1 TSS, 55,386 mm10 annotated transcripts) ordered by BRD4 intensity identifies a cluster of strongly bound transcripts (Cluster 1, n=8080). (F) Gene ontology analysis of Cluster 1 genes identified enriched terms for biological processes, cellular components, and SNP-phenotype associations. (G-H) Track view of Ppargc1a and Ppargc1b genes showing sequencing reads mapping from BRD4 and GATA4 ChIP-seq as well as Control and Brd4-KO ATAC-seq at day 5 post-tamoxifen treatment. The promoter region and a putative regulatory element for each gene is highlighted in red.
