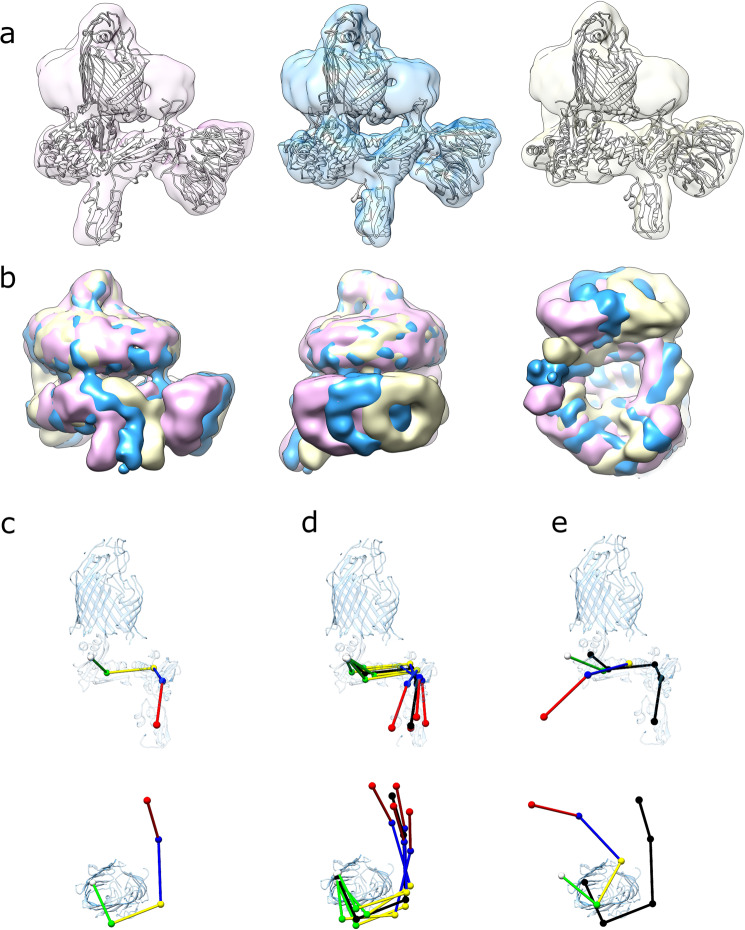
Fig. 5. Cryo-EM structures generated by separation along eigenvectors 0 and 1.
a EM maps of (left to right) conformations 0–1, 0–5 and 0–9, with fitted models. Each reconstruction is aligned on the β-barrel of BamA illustrating the difference in orientation of the bottom half of the complex. b EM maps of conformations 0–1 (pink), 0–5 (gold) and 0–9 (blue) aligned on the β-barrel of BamA and overlaid. c Positions of centres of mass for POTRA domains 1 through 5 (red, blue, yellow, green and white, respectively) in the BAM-nanodisc consensus structure. d Positions of the POTRA domains in the four extremes of the ensemble (0–1, 0–9, 1–2 and 1–8, respectively, coloured) compared with the consensus structure (black). e Comparison of the positions of the POTRA domains in the ‘lateral closed’ crystal structure (5D0O13, coloured) with the BAM-nanodisc consensus structure (black).

