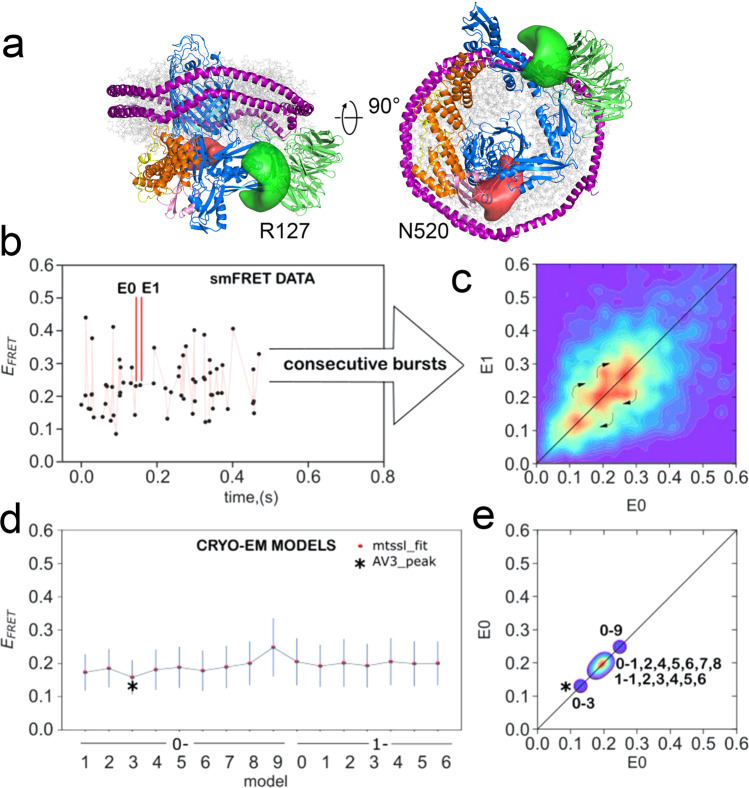
Fig. 6. Comparison of experimentally measured and predicted smFRET values of BAM in MSP1D1 nanodiscs.
a Structure of a dye-labelled double-cysteine variant of BAM (R127C/N520C) predicted from the previous MD simulations. Green and red regions represent possible space filled by Alexa Fluor 488 and Dylight 594 maleimide, respectively. b Representative time trace showing EFRET values for single molecules. c Experimental 2D transfer-efficiency contour plot (RASP analysis, see Methods) showing the measured EFRET between the dyes for pairs of consecutive bursts E0 and E1 with dt < 30 ms. Density on the diagonal line indicates persistent conformational states, while off-diagonal density indicates transitions between those states that occur on a 1–30-ms timescale (curved arrows). d Predicted EFRET for each of the 16 cryo-EM-derived model structures; each point represents the maximum of the predicted distribution as shown for selected structures in Supplementary Fig. 13a. e Projections of the predicted EFRET into a 2D plot for direct comparison with the experimental data (panel b) showing that the static pattern of density along the diagonal could be recapitulated by the 16 cryo-EM-derived model structures. An alternative modelling approach afforded a better match for the data in the case of one structure (0–3 black star).

