
Figure 2. Density distributions of age associations and whole-brain principal component loadings.
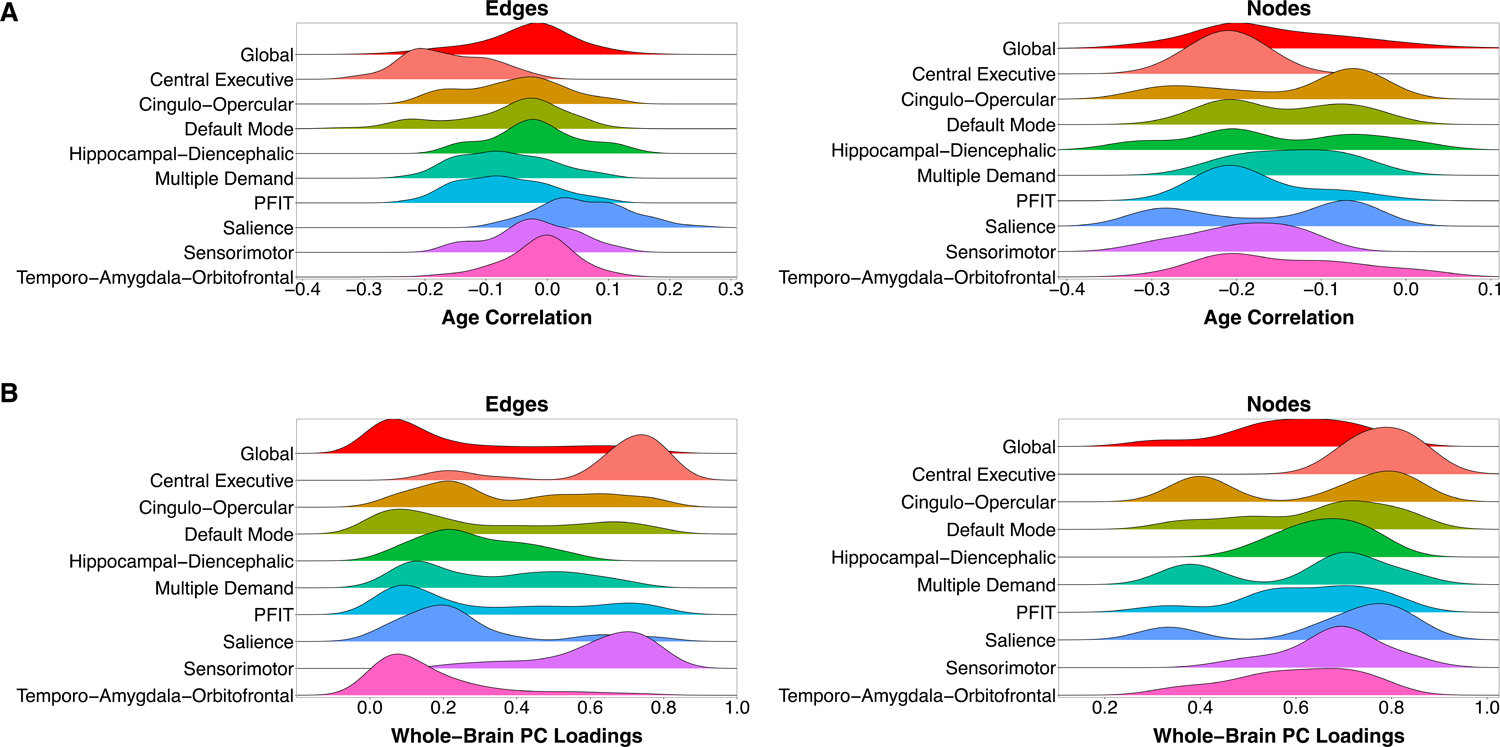
A) Density distributions of each element’s association with age, categorized by prespecified NOI. All NOIs are subsets of the whole-brain (Global) network, such that comparison with the red distribution at the top of both panels is not a comparison of independent elements, but a comparison of a subset to a whole. B) Density distributions of loadings on the first principal component of the whole-brain connectome, categorized by prespecified NOI. Principal component analyses were conducted separately for each NOI.