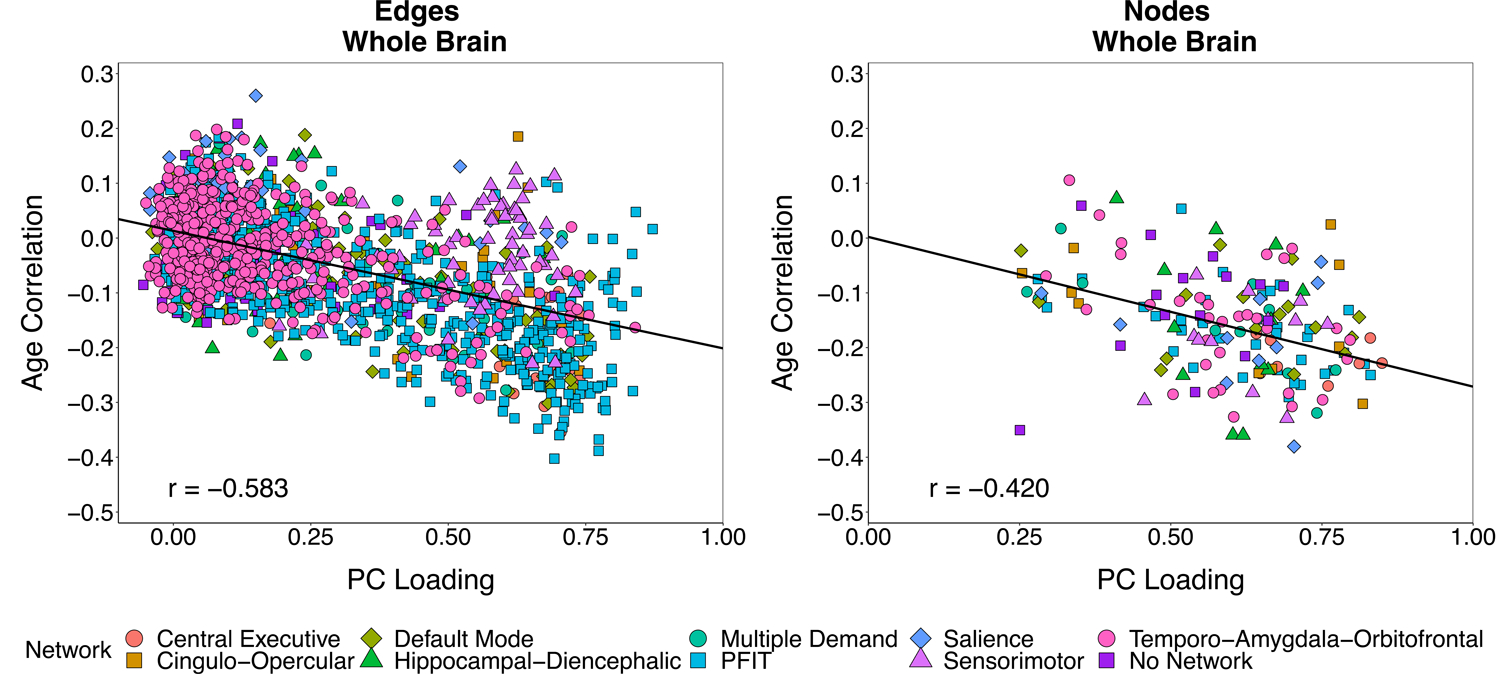
Figure 3. Scatterplot of age correlations and principal component loadings.

Scatterplots of each connectome element’s correlation with age against its loading on a single principal component (based on an age-partialled correlation matrix (Fig. S2)). Analyses were conducted separately for edges (left) and nodes (right). Each point represents a single element of the connectome (3,567 non-zero edges; 85 nodes). Points are categorized by the NOI to which the element belongs. Elements belonging to multiple NOIs are plotted once for each group membership and jittered for the sake of visual interpretation. Reported correlations and displayed regression lines reflect analyses including each element only once.
