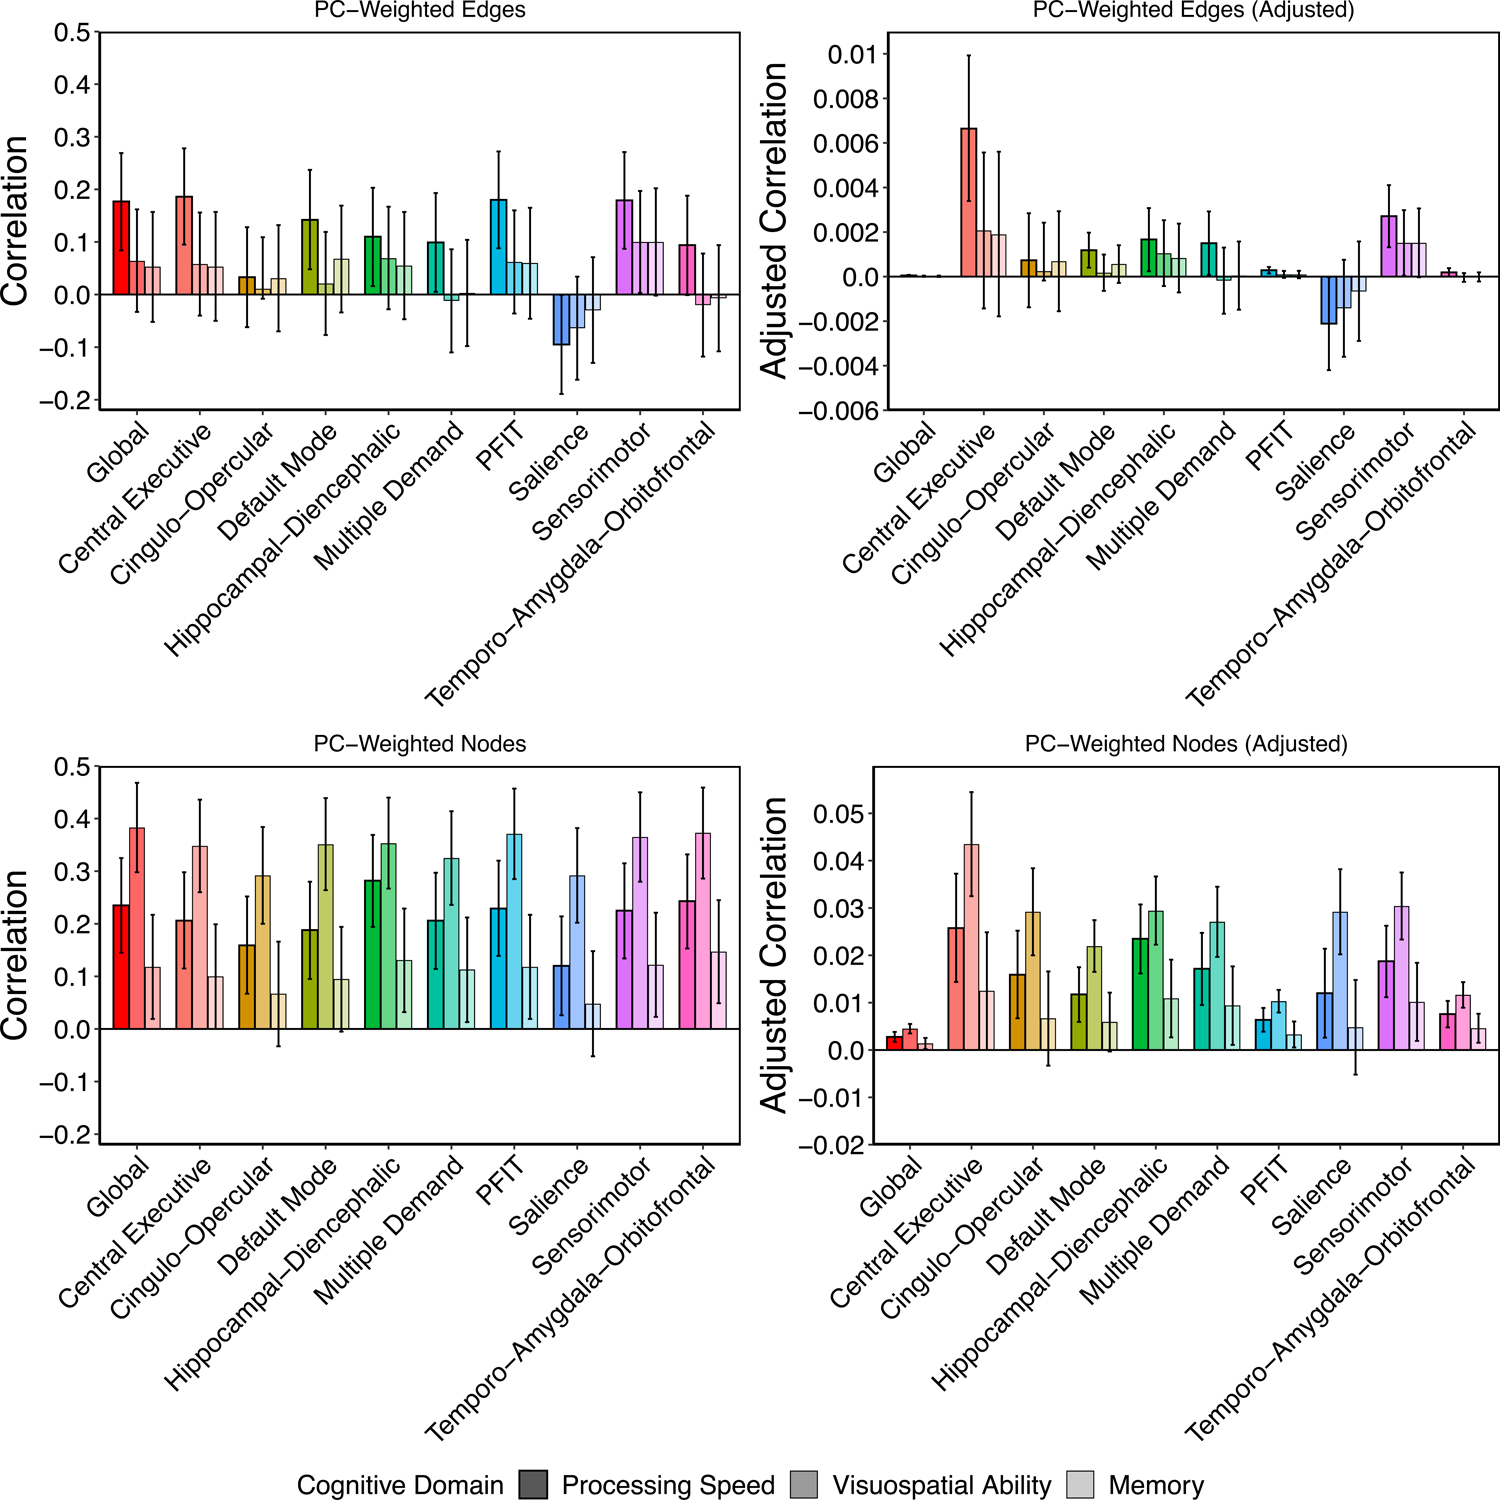
Figure 4. Prediction of cognitive function in LBC1936 from UKB-weighted indices of connectome integrity.

Raw and adjusted associations between weighted-composite scores reflecting variation in overall connectome integrity and cognitive function in LBC1936. Adjusted estimates were created by dividing the raw estimates by the number of edges or nodes in the network. Note that raw associations for edges and nodes are presented on the same y-axis scale, whereas the scale for the adjusted associations differs for edges and nodes. Scores were created across the whole brain and all NOIs by summing the LBC1936 data weighted by each element’s loading on the first principal component of its respective subnetwork discovered in UK Biobank. Plots are broken down by element type (i.e., edges or nodes) and reflect correlations between respective weighted composites from each NOI and the cognitive domains of processing speed, visuospatial ability, and memory. Error bars represent 95% confidence intervals.
