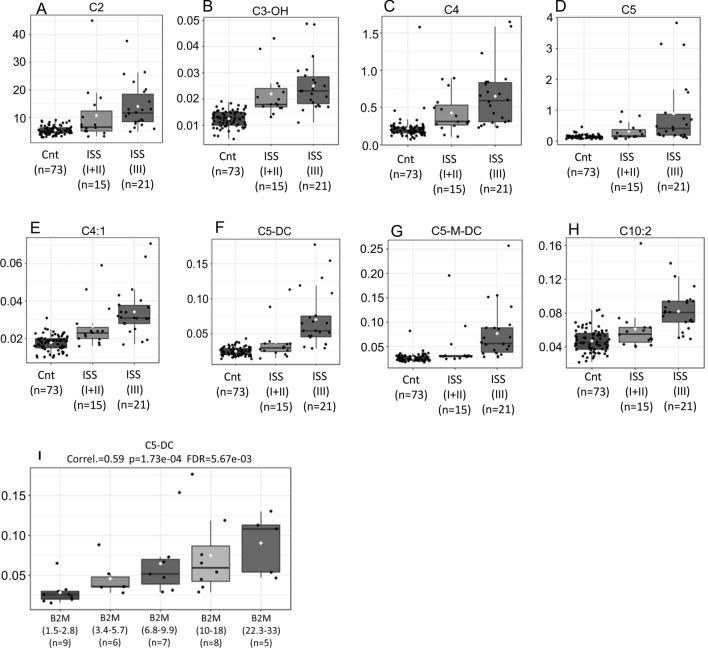
Figure 2.
(A)–(G) and (H) Carnitines (Y-axis) levels in controls, MM ISS1 + 2 and ISS 3 (X-axis) showed association with worse prognosis (p values, FDR, and Fisher’s LSD in supplemental material 3). (I) Correlations between levels of ß2-microglobulin (X-axis) and plasma concentrations of glutarylcarnitine (C5-DC) (Y-axis). The results show that C5-DC levels correlate with progressive elevations of ß2-microglobulin (Pearson's correlation analysis).

