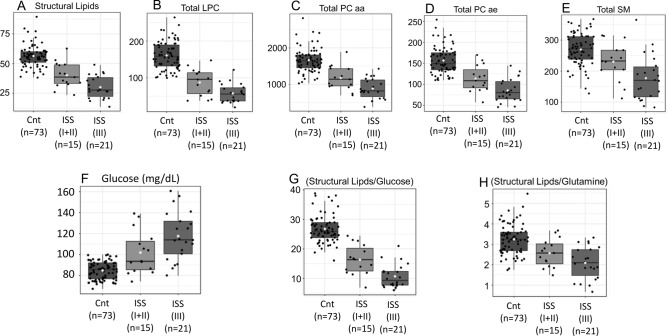
Figure 3.
All lipid classes evaluated showed inverse correlation between the levels of the (A) sum of all structural lipids (Structural Lipids) (Y-axis), (B) lysophosphatidylcholine (Total LPC) (Y-axis), (C,D) phosphatidylcholine (Total PC aa and Total PC ae) (Y-axis), (E) sphingomyelin (Total SM) (Y-axis), and the prognosis of patients with MM. (F–H) showed significant decrease in the production of glucose and glutamine-dependent lipids (Y-axis) in MM patients in relation to controls (X-axis), a phenomenon that is also accentuated with the increase in ISS (p values, FDR and Fisher’s LSD in supplemental material 3).

