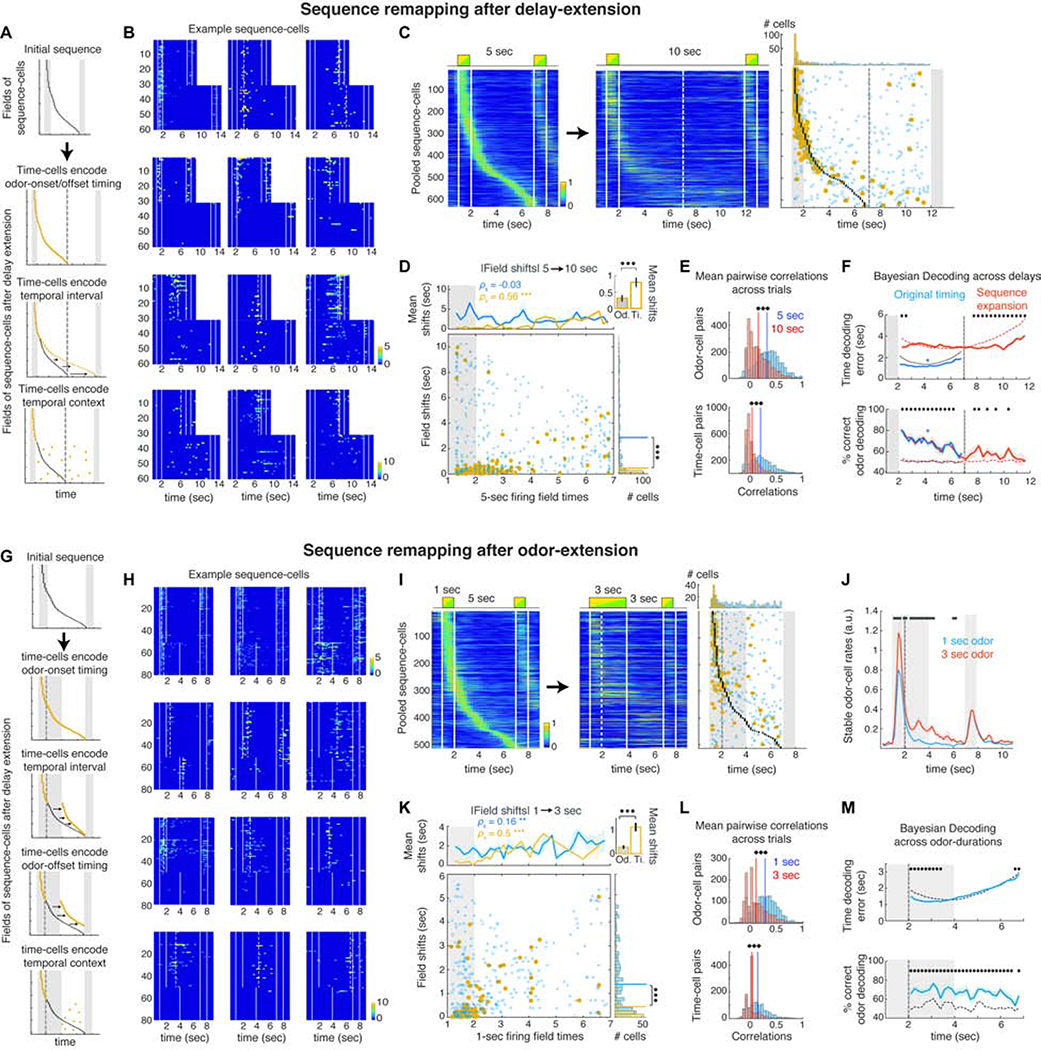
Figure 3: Odor-cells retain their activity whereas time-fields remap when the delay or odor-delivery is extended.
A. Sequence-remapping under different encoding models when the delay period is doubled. Dashed line: Default delay offset. B. Activity across all 5 sec and 10 sec delay trials in example cells that retain a field near the same time-bin, become silent or sparsely activated, exhibit disorganized activation or shift activation to the added delay. Dashed lines: significant fields. C. Pooled sequence-cells mean activity over preferred trials in default and extended delays. Right: Black dots depict fields of the initial sequence. Circles depict the time-bin of each cell’s peak rate in the 10 sec delay trials. Blue: Non-significant peaks. Yellow: Significant fields. Dashed lines: 5 sec delay offset. Top: Distributions of significant and non-significant peaks. D. Absolute time-shifts of peak activation in the extended trials as a function of their initial field. Top: Mean shifts for stable (yellow) and unstable cells (blue). *** P < 0.001, SPT. Inset: Mean shifts of stable odor- and time-cells (P < 0.001, WT). Right: Histogram of field shifts. Lines: distribution means (P < 0.001, two-sample Kolmogorov-Smirnov test). E. Average pairwise correlations for odor and time-cells before and after delay extension. Solid lines: Distribution means (*** P < 0.001; paired t-test). F. Mean time-decoding error (absolute values) and odor decoding accuracy, using Bayesian decoders trained on the original time-cell activity and decoding either the first 5 sec of the extended trials (blue) or the entire 10 sec delays under a ‘sequence-expansion’ model (Methods; red). Dashed curves: Chance baseline (* P < 0.05; blue *: P < 0.05 for all time-bins; WT; FDR). G. Sequence-remapping schemes when odor delivery is extended over the delay. Dashed line: Offset of default odor delivery. H. Example cells during default and extended-odor trials, as in B. Top row: Cells retaining or expanding their field over the prolonged odor. Rest: Examples of field shifts, disorganized or sparse activation. I. Pooled sequence-cells over the default and prolonged-odor trials as in C. J. Mean rates of stable odor-cells during default and prolonged-odor trials (black bars: P < 0.05, WT, FDR). K. Time-shifts of peak activity during the prolonged-odor trials, plotted as in D. L. Pairwise correlations before and after odor-prolongation, as in E. M. Time decoding error and odor decoding accuracy in prolonged-odor trials with Bayesian decoders trained on original time-cell activity, plotted as in F (* P < 0.05; WT; FDR).

