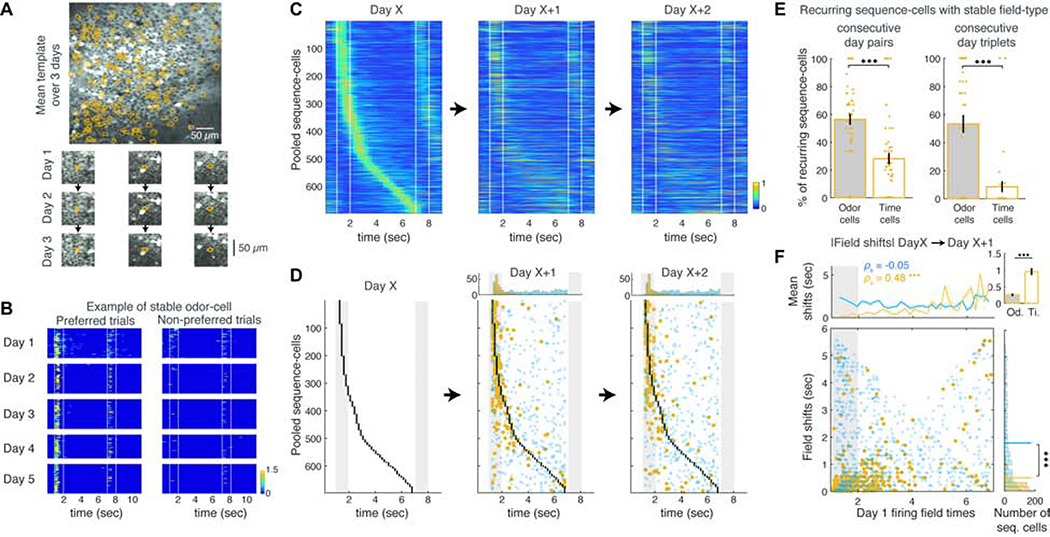
Figure 5: Odor-cells retain their activity whereas time-fields remap across days.
A. Example FOV averaged over 3 consecutive days. Contours: cells registered across all days. Bottom: Example registered cells on each day. B. Firing rate of an example stable odor-cell over all preferred and non-preferred trials during 5 consecutive days. C. Pooled sequence-cell rates from any Day X and their activity during the next two days, stacked in the same order (only cells matched over all 3 days included). D. Same as panel C, showing the original fields of Day X (black dots) and their peak activity time-bins in following days. Stable and unstable cells shown as before (blue and yellow respectively). Top: Distributions of significant and non-significant fields each day. E. Mean ratio of stable odor- versus time-cells between two or three consecutive days. *** P < 0.001, t-test). F. Absolute time shifts of sequence-cells over consecutive days as a function of their initial field, plotted as in Figure 3D.

