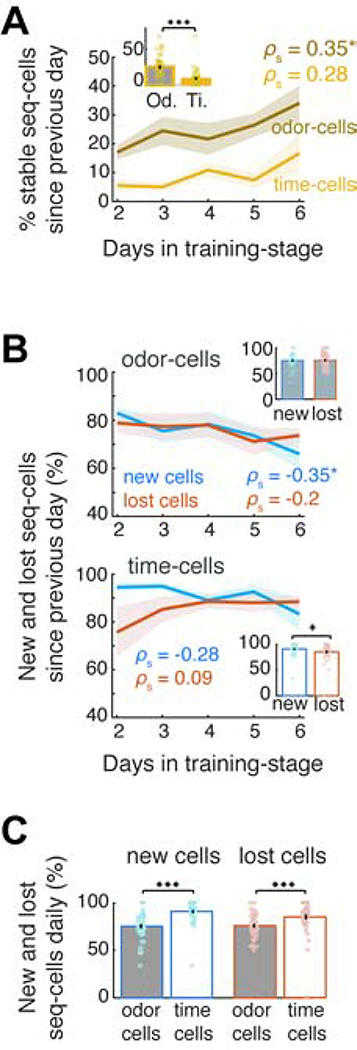
Figure 6: Higher daily inflow of new cells than outflow of lost ones.
A. % odor- and time-cells daily that retained a field in the same sequence from the previous day (‘stable’). * P < 0.05, SPT, FDR over two cell groups. Inset: Mean across days. *** P < 0.001; WT. B. Inflow of new odor-cells and time-cells (blue) versus outflow of lost ones daily (red; see text for definition). Insets as in A. * P < 0.05, paired t-test. C. Mean daily inflow of new versus outflow of lost sequence-cells. *** P < 0.001, WT, FDR.

