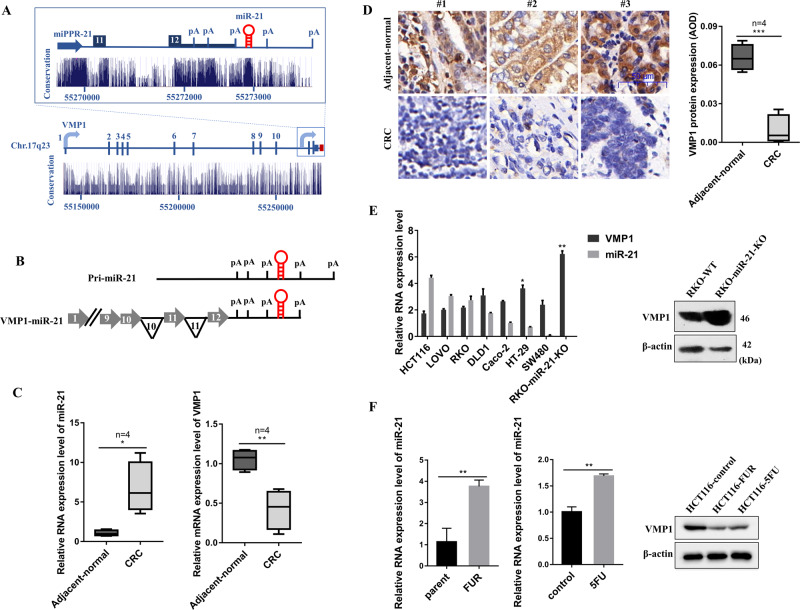
Fig. 1. The expression of miR-21 is negatively correlated with VMP1 in colorectal cancer.
a Structure of the VMP1 and miR-21 loci at chromosome 17q23. VMP1 exon numbers are noted, inset highlights the pri-miR-21 gene region. The blue-black arrow is situated at the miR-21 promoter, miPPR-21. The line of intermediate thickness indicates the 3-UTR of VMP1. The red hairpin indicates the location of the pre-miR-21 hairpin. Polyadenylation signals are indicated as pA. Evolutionary conservation (UCSC Genome Browser 28 species conservation track, NCBI36/hg18 assembly) is plotted below. b Schematic of the transcripts pri-miR-21 and VMP1-miR-21. Horizontal gray arrows represent exons and black lines represent introns (numbered in black) and non-coding sequences. Break symbols (double slash mark) are placed between exons 1 and 9 of VMP1. c qPCR analysis for miR-21 and VMP1 expression in colorectal cancer tissues and adjacent non-cancer tissues. d IHC analysis for the protein expression level of VMP1 in colorectal cancer tissues and adjacent non-cancer tissues. e The mRNA expression level of miR-21 and VMP1 was measured by qPCR in various colorectal cancer cells. The protein expression of VMP1 was measured by Western blot in parental RKO and RKO-miR-21-KO cells. f The mRNA expression of miR-21 was measured by qPCR, the protein expression of VMP1 was measured by Western blot in HCT116 cells treated with 10 µM 5-FU for 24 h and HCT116-5FUR cells, compared with the control group. (Scale bars, 50 µm) Data are presented as mean ± SD. ***P < 0.001, **P < 0.01, *P < 0.05.

