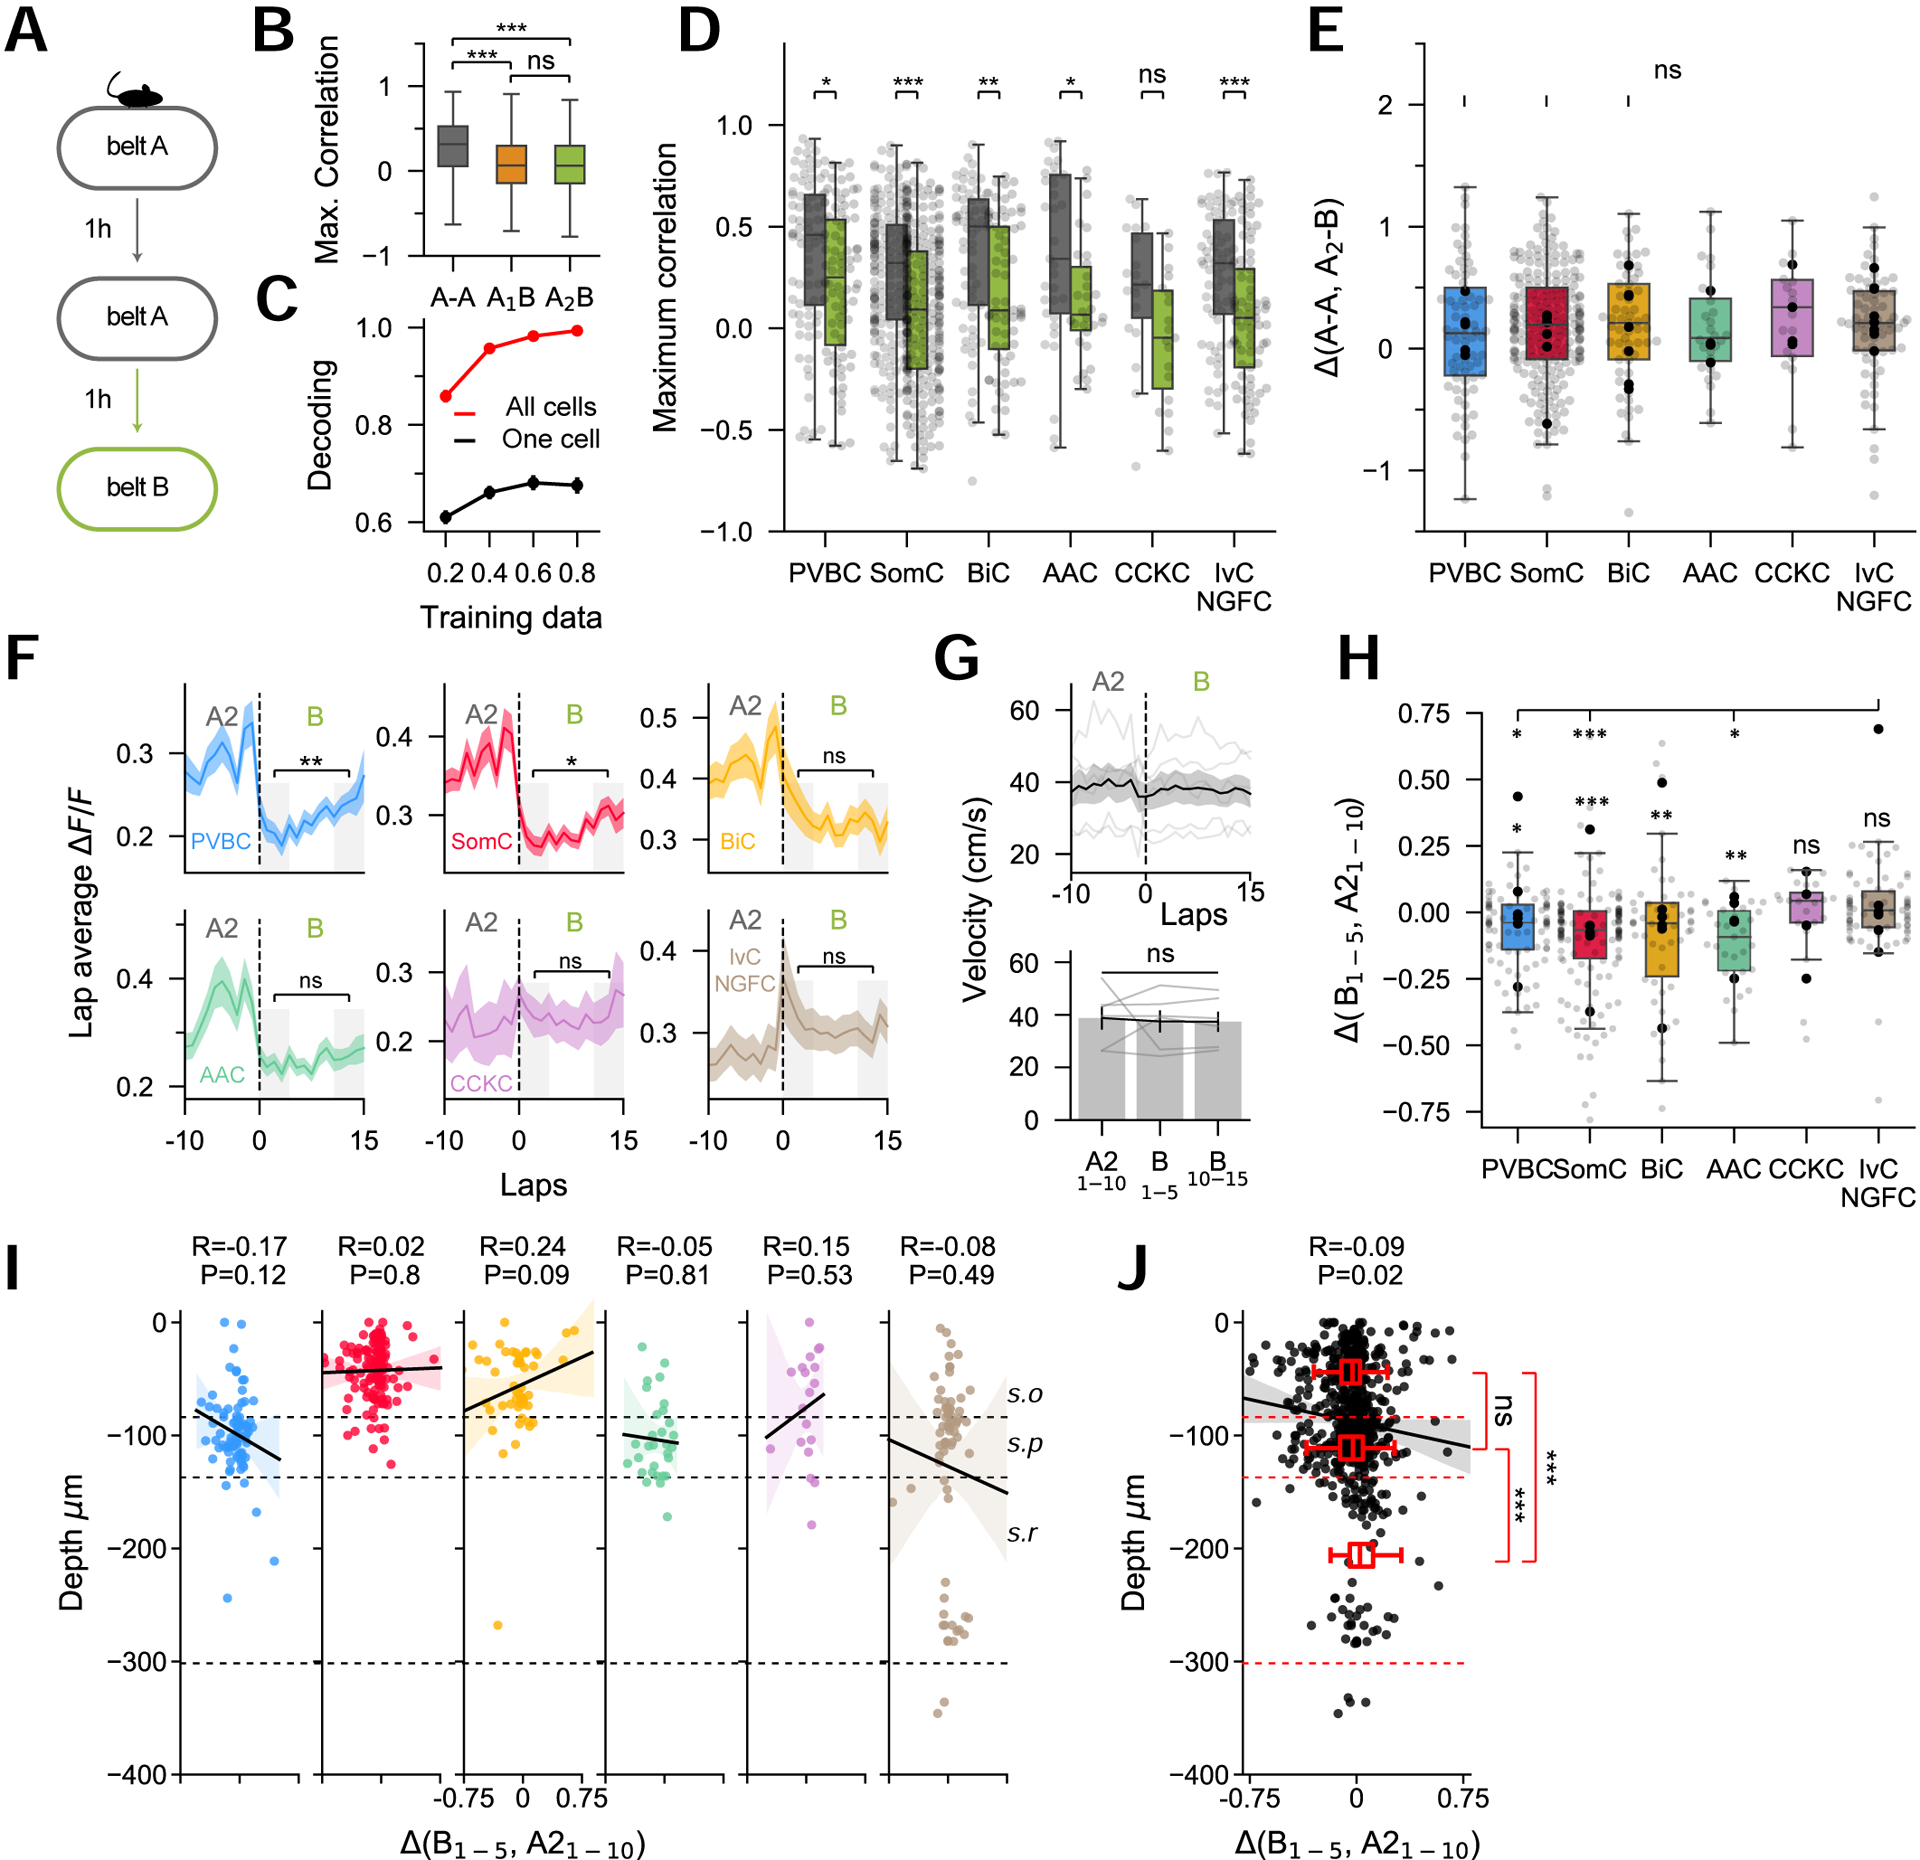
Figure 5: Interneurons encode contextual information at the population level and rapidly modulate their activity in novel contexts.

A. Mice ran in a familiar context (belt ‘A’) twice and were then exposed to a new context (belt ‘B’).
B. Tuning curve correlation coefficients between contexts ‘A’ and ‘B’ (n = 1080 cells from 6 mice, one-way ANOVA, p < 10−10).
C. Context identity can be reliably decoded using a SVM classifier (n = 6 mice).
D. Correlations between A1-A2 (gray) and between A2-B (green) for the different subtypes (n = 74 PVBC, 216 SomC, 64 BiC, 29 AAC, 19 CCKC, 73 IvC/NGFC from n = 6 mice, paired t-tests).
E. Difference (delta) between A1-A2 and A2-B correlation coefficients (same n as K, one-way ANOVA, p = 0.96).
F. Average ΔF/F during running on each lap during the last 10 laps of A2 and the first 15 laps of B. In belt B, paired t-tests between the first 5 and last 5 laps (same n as K).
G. Top: Velocity profiles during change of belt for n = 6 mice. Bottom: Average velocity quantification in last 10 laps of A2, first 5 laps in B and last 5 laps in B (one-way ANOVA, p = 0.96).
H. Difference (delta) in ΔF/F between the last 10 laps in A2 and the first 5 laps in B (one-way ANOVA, p < 0.001 between groups). The decrease seen in belt B was also assessed by testing delta to a mean of 0 (one-sample t-test, P-value above each bar).
I. Depth distribution as a function of the change in activity (delta) for each subtype. Shaded areas represent bootstrapped confidence intervals.
J. Depth distribution as a function of delta for all interneurons (n = 660 cells), regardless of subtype identity. Interneurons in s.r. are less affected by the change of context (unpaired t-tests).
ANOVA tests are corrected for multiple testing using post hoc Tukey’s range test. Mouse averages are indicated by the black dots. Data are represented as mean ± sem. *p<0.05, **p<0.01, ***p<0.001.
