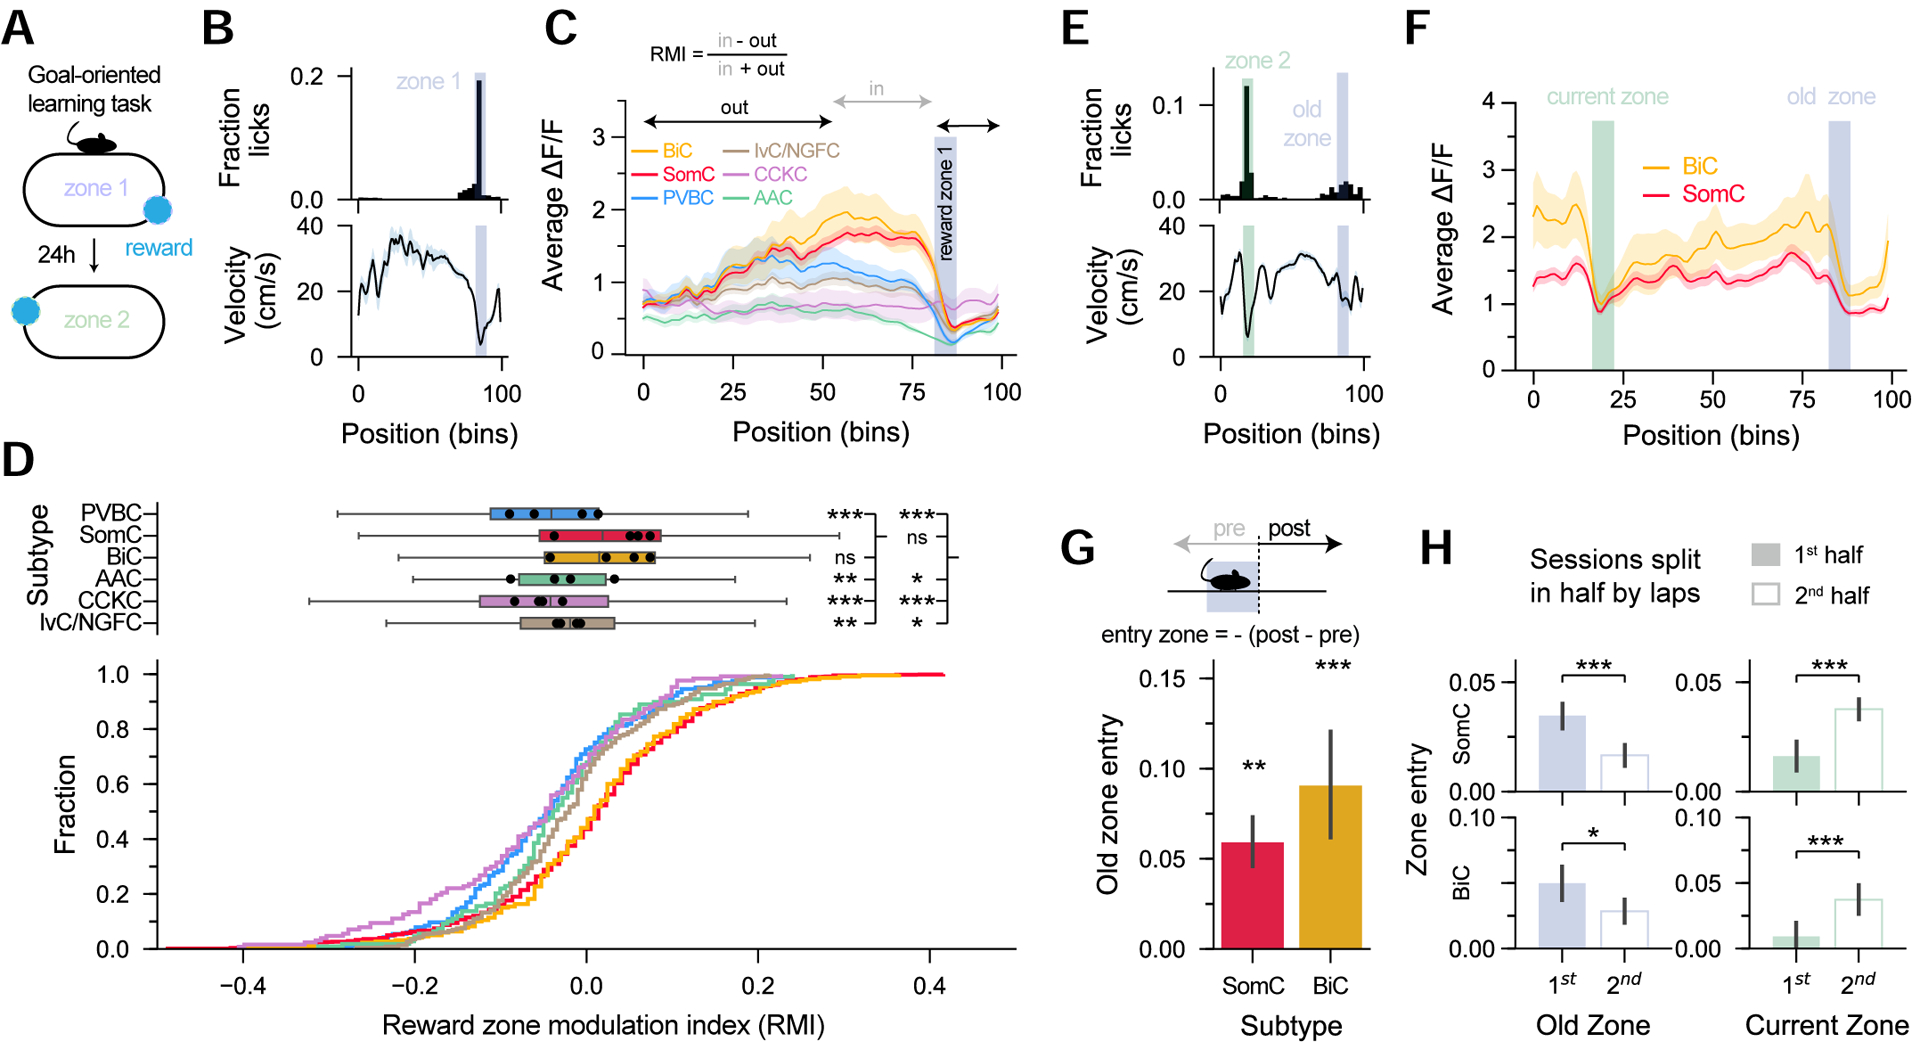
Figure 6: SomC and BiC subtypes are preferentially modulated by reward during goal-oriented learning.

A. Mice ran to find a ‘hidden’ water reward, kept in a fixed location throughout the session, but changed each day (zone1 to zone 2).
B. Top: Representative histogram of licks in each position bin from one session. Blue shaded area represents the rewarded zone. Bottom: Corresponding velocity profile.
C. Representative average ΔF/F in each position bin for each subtype. BiC and SomC show increased activity preceding the reward zone.
D. Reward zone modulation index cumulative fraction (bottom) and box plots (top). BiC and SomC have higher modulations than other subtypes (n = 165 PVBC, 830 SomC, 220 BiC, 109 AAC, 127 CCKC, 228 IvC/NGFC from n = 4 mice, one-way ANOVA, p < 10−10).
E. Top: Representative histogram of licks and (bottom) velocity profile after translocation of the reward zone.
F. Representative BiC and SomC average activity by position bin from one session, showing traces of the old zone location.
G. Quantification of the old zone entry shows significantly higher modulation than expected by chance (n = 314 SomC, 103 BiC from n = 4 mice, one-sample t-test).
H. Quantification of old zone modulation and comparison between the first half and second half of the session. The modulation in the old zone for both BiC and SomC decreases with time while the modulation in the current reward zone increases, showing that BiC and SomC have remnants of the old reward representation (Same n as in G, paired t-tests).
ANOVA tests are corrected for multiple testing using post hoc Tukey’s range test. Mouse averages are indicated by the black dots. Data are represented as mean ± sem. *p<0.05, **p<0.01, ***p<0.001.
