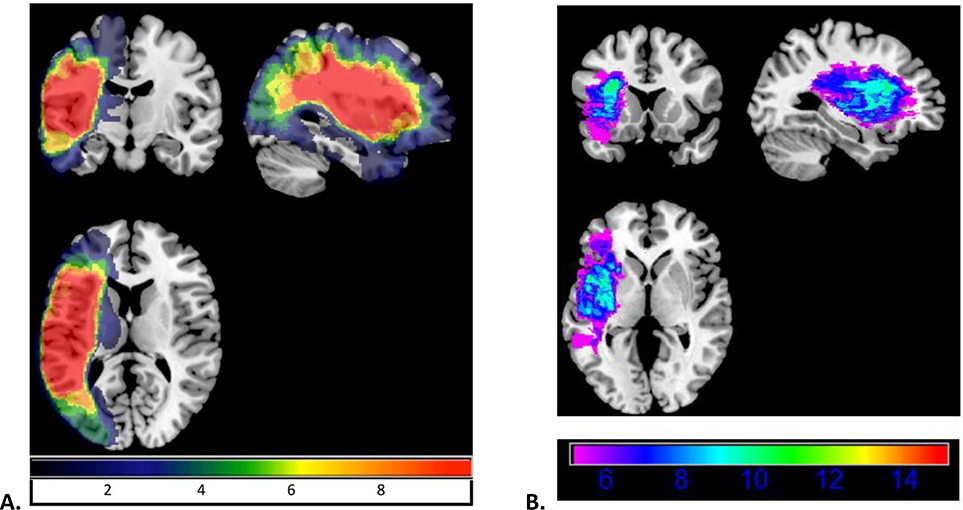
Figure 2.
Lesion overlap map for all participants with aphasia. Panel A shows the overlap in all regions. Panel B only shows the regions in which at least 5 participants (approximately 20%) had damage. In both panels, areas highlighted in warmer colors were damaged in a greater number of participants.

