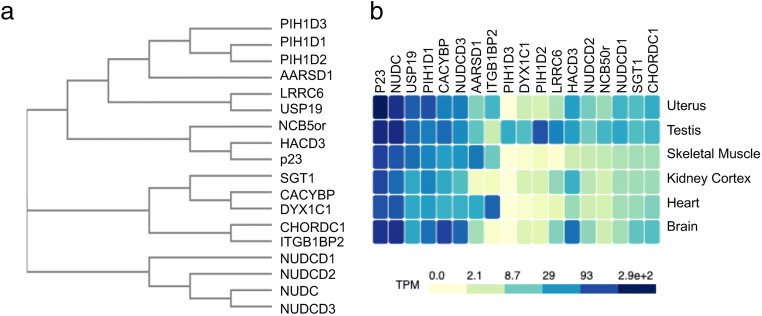
Fig. 2.
a Phylogenetic tree showing homology of cochaperones with p23-like CS domains. The sequences corresponding to the CS domain of human cochaperones were aligned with Clustal Omega. The accession sequences for each cochaperone are listed in Table S1. b The Genotype-Tissue Expression (GTEx) database (gtexportal.org) was used to compare mRNA expression data for each of the cochaperones across a range of human tissues. Brain = frontal cortex, heart = atrial appendage. The hatched polygons show the mean transcripts per million (TPM) of the mRNA encoding the indicated cochaperone in the tissue shown. Darker colors represent higher expression levels

