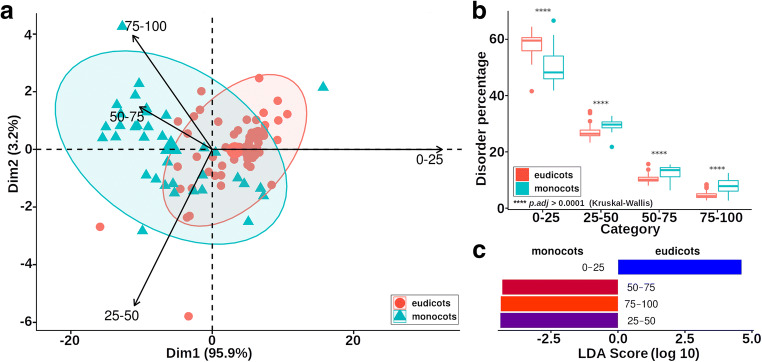
Fig. 2.
Comparison between the proteomes of monocots and dicots considering the disorder abundance. a PCA biplot of the four categories of disordered proteins between eudicots and monocots. Vectors are plotted towards the direction of its major abundance in the samples. b Paired comparisons reveal differences in the relative protein content of each disorder category. c LEfSe analysis results. The category 0–25 is better represented in the eudicots, while the categories 25–50, 50–75, and 75–100 are better represented in the monocots

