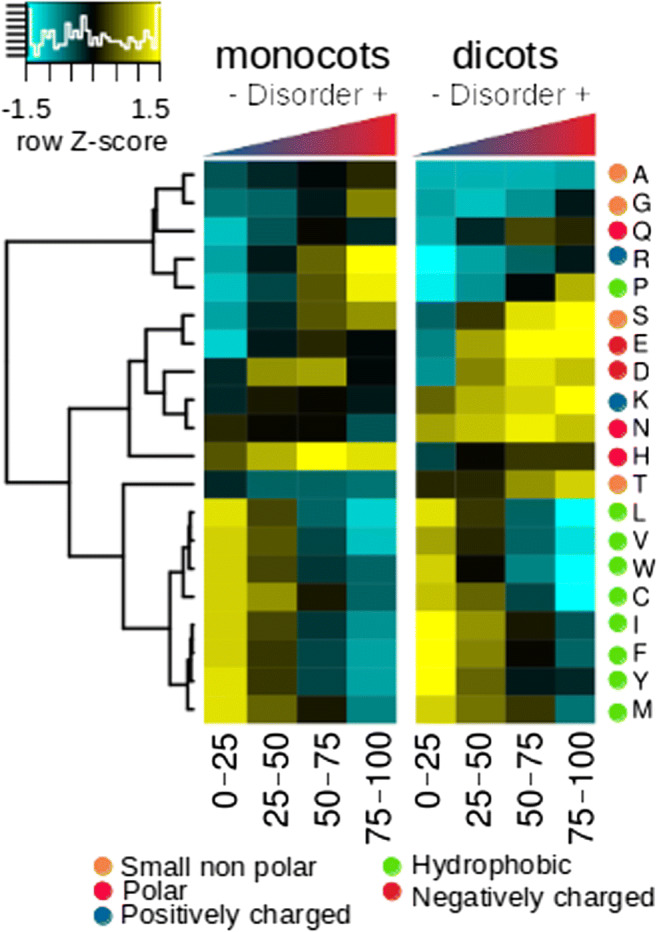
Fig. 4.

A heat map of the percentage composition of the amino acids that make up the proteins according to the level of intrinsic disorder. The hydrophobic amino acids separated perfectly from the rest, with the exception of P. These amino acids were enriched in the most structured proteins and had a more uniform abundance pattern compared with the rest of the amino acids. The disorder-promoting amino acids were enriched (K, E, P, S, Q, R, D) in the proteins with the highest levels of disorder, with the exception of M, which did not seem to follow this typical behavior. The enrichment in the relative abundance of these amino acids was not constant between clades, which seems to be influenced by taxonomic factors
