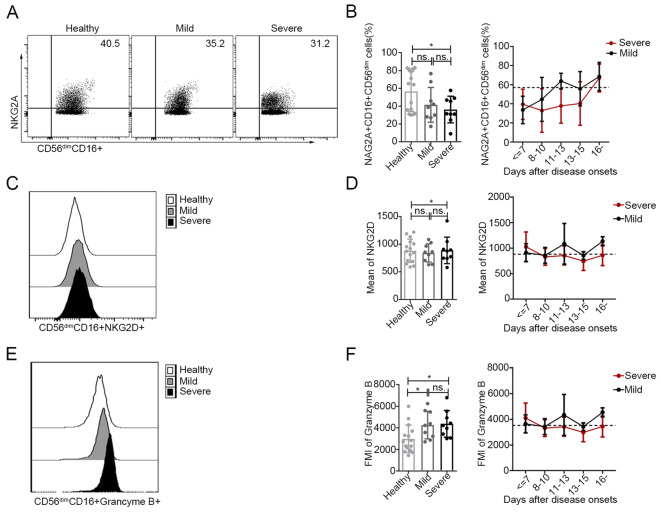
Fig. 4.
Increased activation of CD56dimCD16+ NK cells in patients with SFTS A, C and E The expression levels of NKG2A (A), NKG2D (C) and granzyme B (E) in CD56dimCD16+ NK cells were analysed by flow cytometry in one representative healthy control, one representative patient with mild disease and one representative patient with severe disease. B, D and F Expression levels of NKG2A, KNG2D and granzyme B in CD56dimCD16+ NK cells in the healthy controls (n = 15) and in patients with mild (n = 9) and severe (n = 9) SFTS upon admission (left panels of B, D and F) at different time points during their entire hospital stay (right panels of B, D and f). The dashed line represents the mean of the healthy controls. Data are shown as the mean ± SD. Statistical analysis was performed using the two-tailed unpaired t test or multiple t tests. The level of significance is indicated as follows: ns, not significant; * P < 0.05

