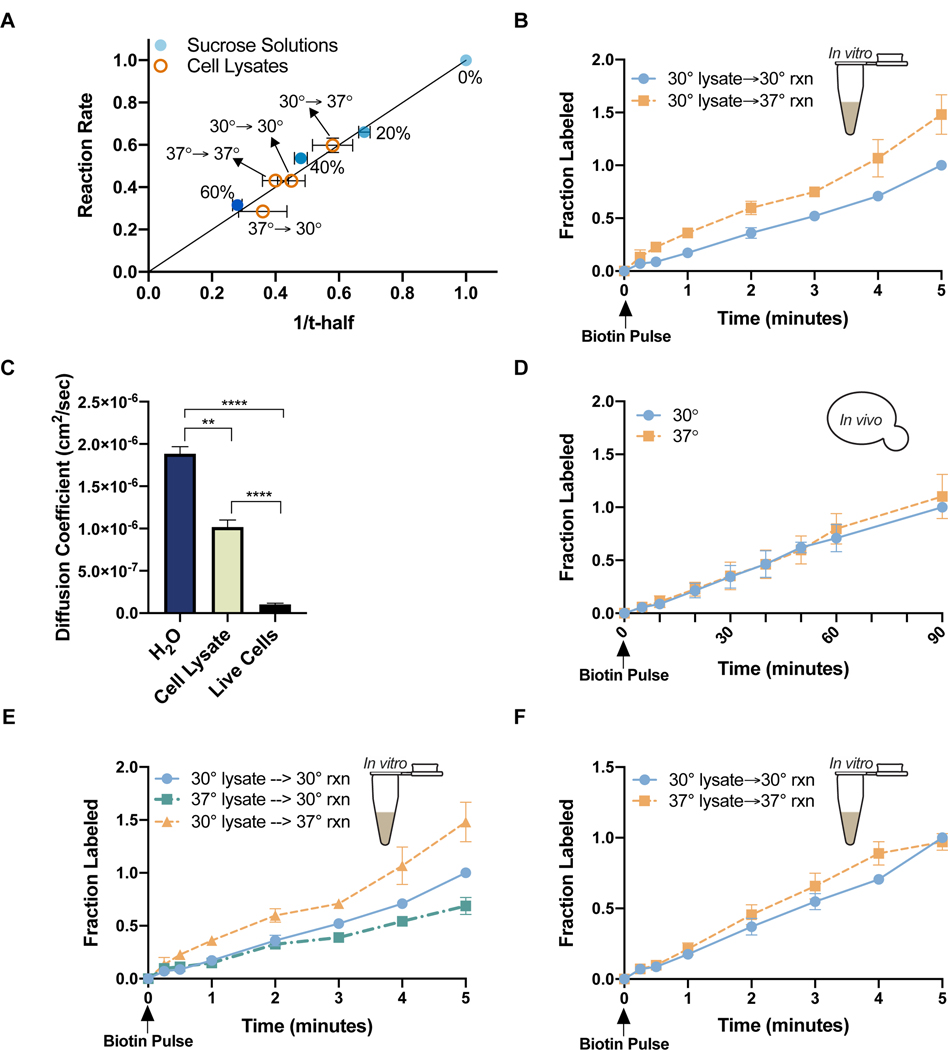
Figure 1. A viscosity-controlled model reaction is temperature-sensitive in cell lysates but not live cells.
(A) Biotinylation rate vs viscosity (1/t-half) for reactions carried out in 0%, 20%, 40%, or 60% sucrose solutions (●blue) or cell lysates (○orange). Reaction rates and t-half values were normalized to their respective values in H2O. Horizontal error bars are s.e.m. (n> 3 FRAP experiments). Vertical error bars are the standard error of the slope derived from the best fit line for multiple timecourses (n> 5 timecourses/condition) (B) Biotinylation rates in lysates. Cell growth temperature (left of arrow) and reaction temperature (right of arrow) are indicated in the figure key. Normalized to max labeling at 30°C (nonlinear regression, difference between slopes, p<.0001) (C) Diffusion coefficients for GFP in pure H20 (n=4), lysate from cells grown at 30°C (n=3), and live cells growing at 30°C (n=19) (unpaired t-test, H20 vs cell lysate p=.0037; cell lysate vs live cells p<.0001; H2O vs live cells p<.0001) (D) Biotinylation rates in live cells growing at 30°C (●blue) or 37°C (◼orange). Measurements are at the growth temperatures of the cells. Normalized to max labeling at 30°C (n=4 timecourses/temperature) (nonlinear regression, difference between slopes p=0.1) (E) Biotinylation rates in lysates from cells grown and measured at the indicated temperatures. Normalized to max labeling for 30°C→30°C (nonlinear regression difference between slopes, 30°C→30°C vs 30°C→37°C p>.0001; 30°C→30°C vs 37°C→30°C p>.0001; 30°C→37°C vs 37°C→30°C p>.0001) (F) Biotinylation rates measured at the same temperature of cell growth prior to lysis. Normalized to max labeling at 30°C→30°C (nonlinear regression, difference between slopes, 30°C→30°C vs 30°C→37°C p=.01) Error bars are s.e.m. Points without visible error bars have error within the size of the point. See also Figure S1.

