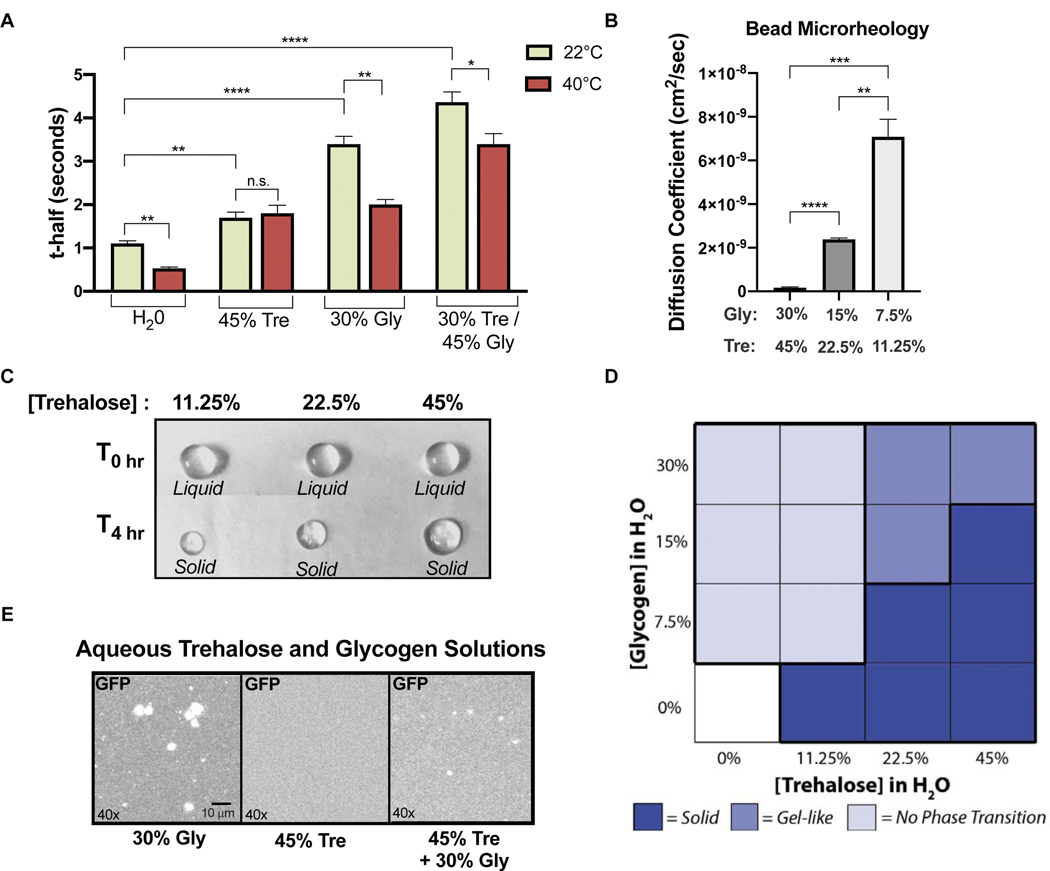
Figure 5. Glycogen and trehalose alter molecular movement in vitro.
(A) FRAP on purified GFP in aqueous solutions of glycogen and trehalose at 22°C and 40°C reported as t-half (n>3)(unpaired t-test, H2O 22°C vs H2O 40°C p=.0023; 45%Tre 22°C vs 45%Tre 40°C p=.636; 30%Gly 22°C vs 30%Gly 40°C p=.0013; Gly/Tre 22°C vs Gly/Tre 40°C p=.0286; H2O 22°C vs 45%Tre 22°C p=.005; H2O 22°C vs 30%Gly 22°C p<.0001; H2O 22°C vs Gly/Tre 22°C p<.0001) (B) FRAP on GFP in serial dilutions of glycogen and trehalose, measured at 22°C and reported as the diffusion coefficient of GFP (n=3)(unpaired t-test, 11.25/7.5 vs 45/30 p=.0001; 11.25/7.5 vs 22.5/15 p=.0011; 22.5/15 vs 45/30 p<.0001) C) Aqueous solutions of trehalose at the indicated concentrations in liquid droplets (top row) or after solidification(bottom row). Initial droplet diameter is 4 mm. (D) Summary of phase observations for glycogen and trehalose droplets of varying concentrations at 22°C, see Figure S5B for phase designation criteria. (E) Fluorescent images of purified GFP in glycogen and trehalose solutions. See also Figure S5.

