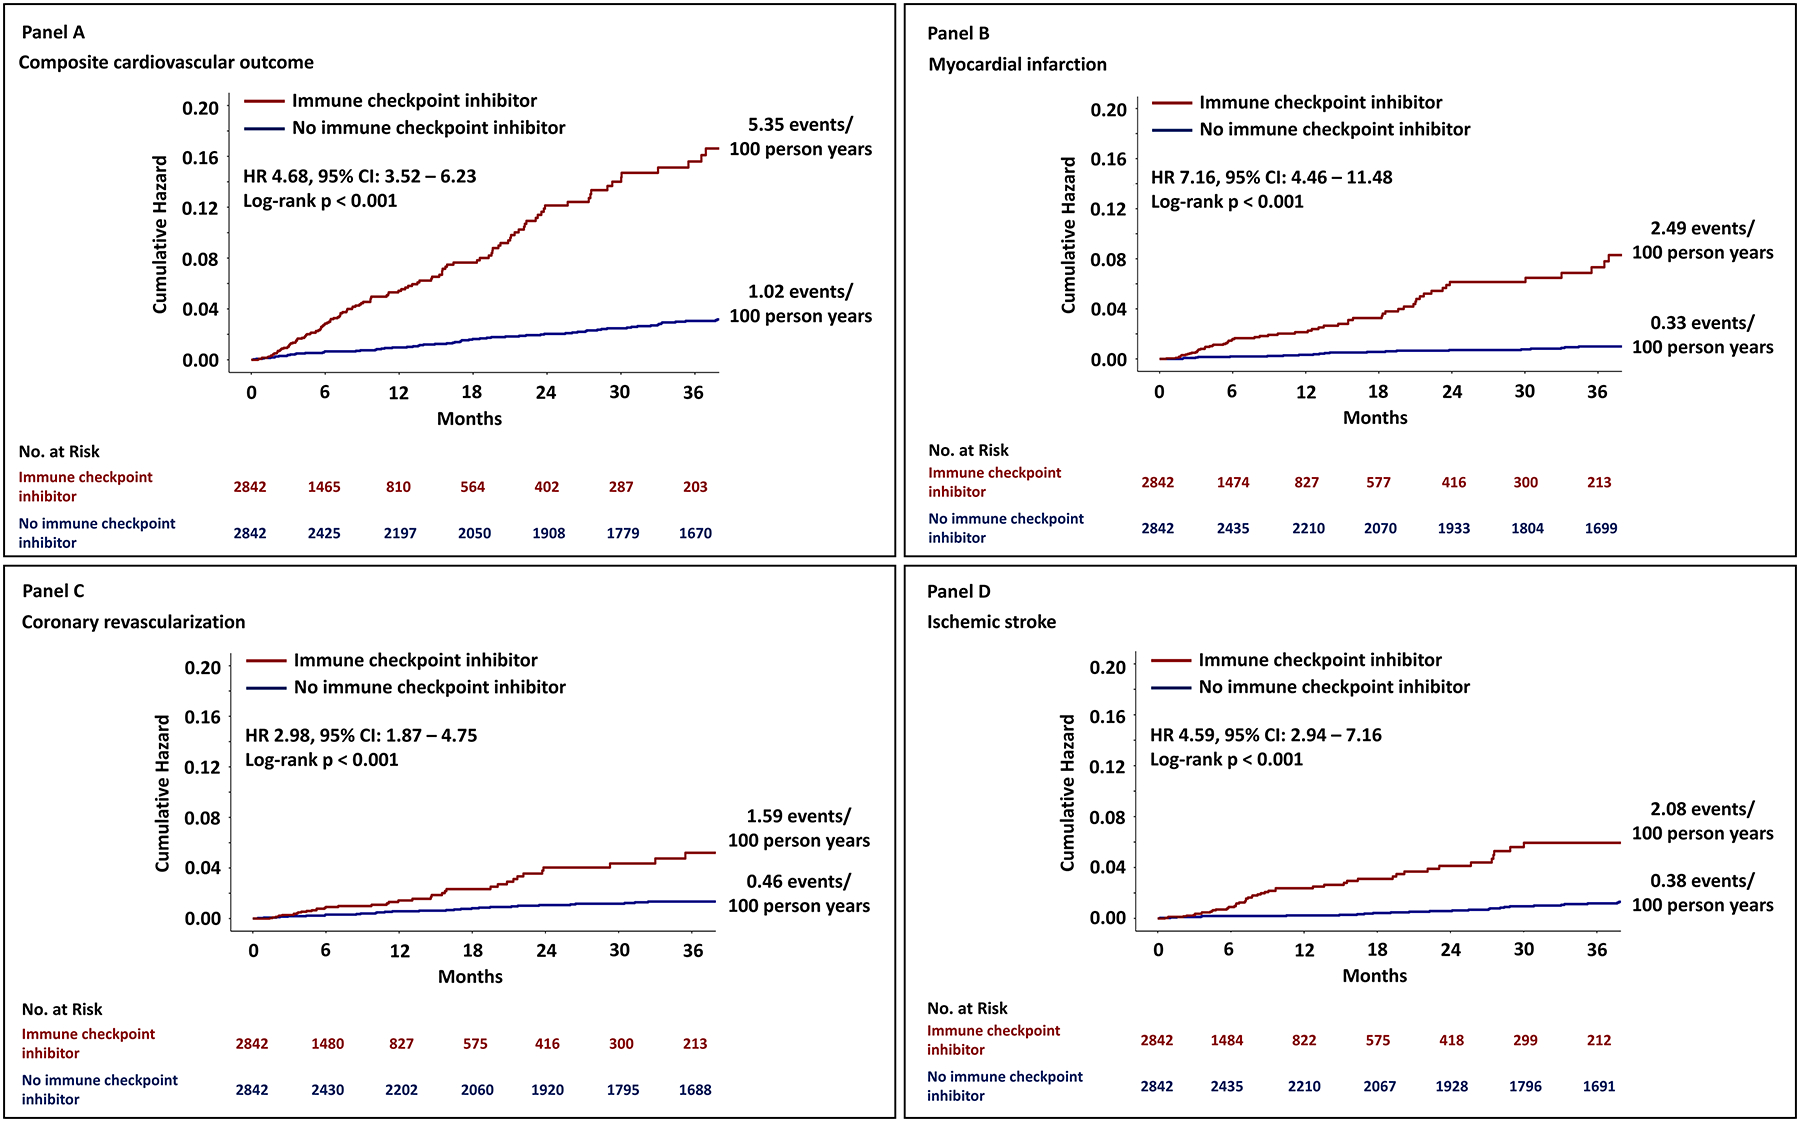
Figure 2. Kaplan Meier curves of the cumulative hazard for atherosclerotic cardiovascular events.

Panel A shows the cumulative hazard for the composite cardiovascular outcome. The individual components of the primary outcome are also shown in Panel B, C and D. Cases (those treated with an ICI) are marked with red, and controls (not treated with an ICI) are marked with blue.
