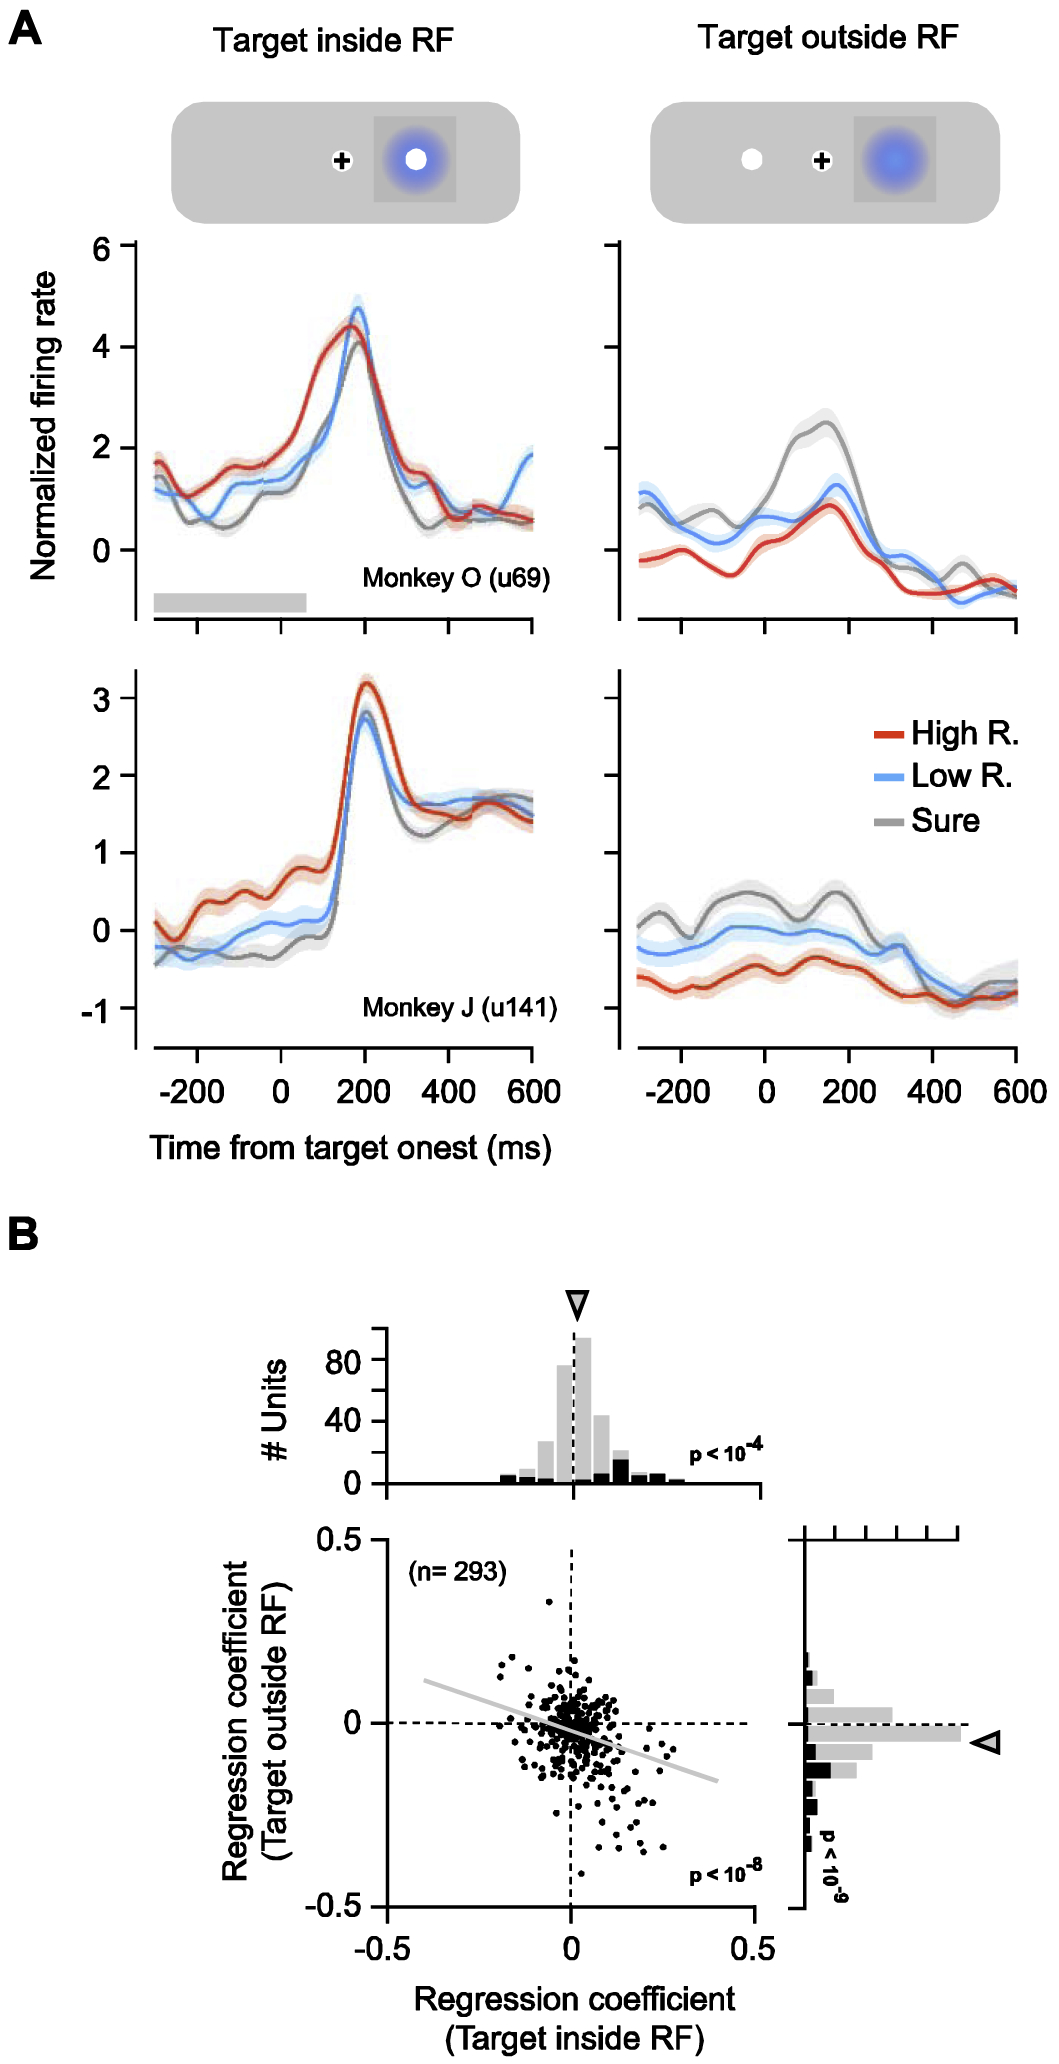
Fig. 3. Neuronal responses were correlated with subjective value during the pre-target period.

(A) Mean neuronal responses from two example recordings shown for different subjective value conditions for targets appearing inside (left) and outside of (right) the RF. The shaded region denotes ± SEM. Gray bar at the bottom indicates the time epoch used in the analyses. (B) Regression coefficients for the subjective value of the targets appearing inside and outside the RF across all recordings. Black bars in marginal distributions denote individually significant coefficients. Arrows indicate means.
