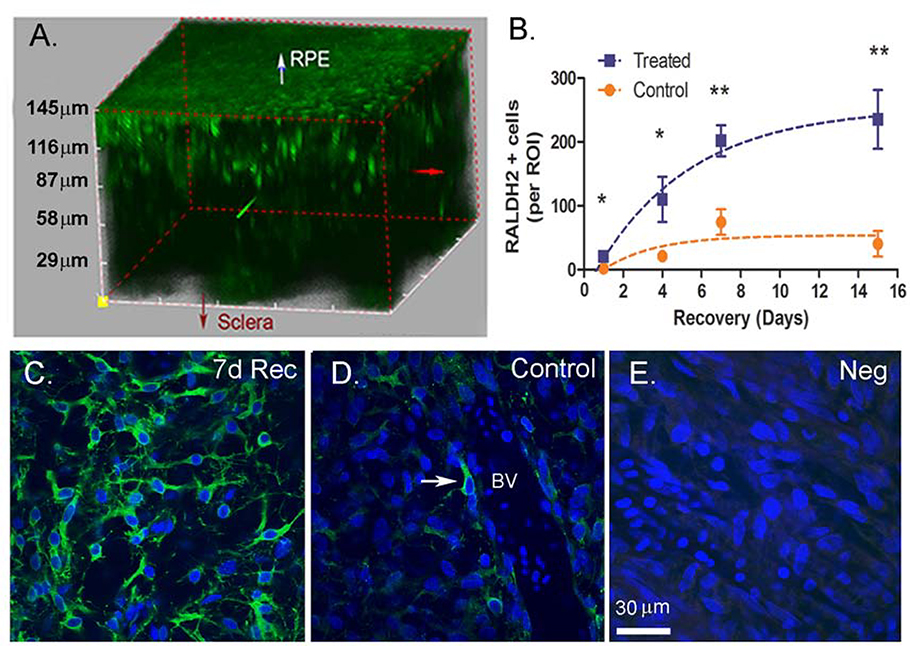
Figure 1.
Multiphoton images and quantification of RALDH2 expressing cells (green) in control and recovering choroids. (A) RALDH2 immunopositive cells in chick choroids following 7 days of recovery from induced myopia. (B) Average total RALDH2 cell number ( ± SEM) in control and treated choroids following 1 – 15 days of recovery. Results were calculated as total number of RALDH2-positive cells per each 510 μm x 510 μm x 3 μm (x, y, z, respectively) slice within each ROI [n = 2 regions of interest (ROI’s) for each of two animals in each group (4 total ROI’s / condition). (C, D) RALDH2-labeled cells were present as variably shaped cells throughout the extravascular choroidal stroma with some in close association with blood vessels (D, arrow). (E) Negative control (incubation in preimmune rabbit serum instead of primary antibody). 7d Rec, 7-day recovery; BV, blood vessel; Scale bar: 30 μm in (C–E). *p < 0.05; **p < 0.01 (paired t-test).

