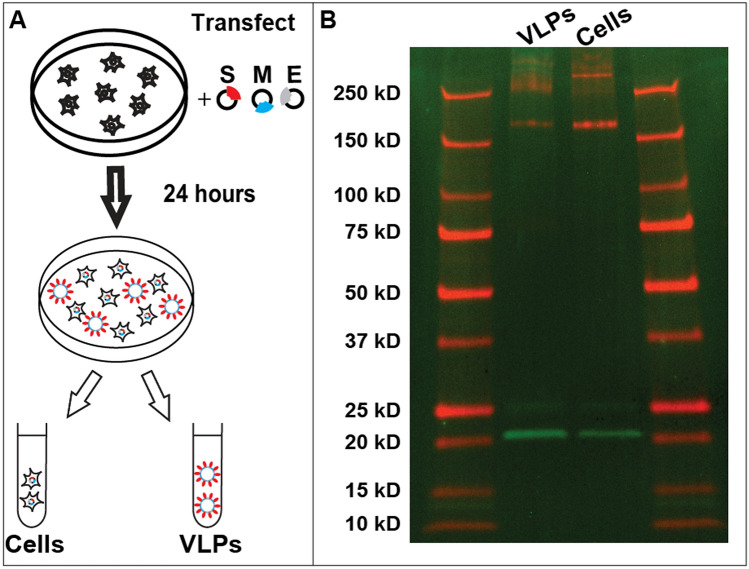
Figure 1.
VLP expression and characterization using western blots. (A) Schematic representation of transfection and VLP harvest. (B) Western blot analysis of cells as well as VLPs separated as explained in methods. The gel was performed simultaneously, scanned at 700 nm and 800 nm, then superimposed using ImageJ (NIH) color merge for greater clarity, followed by cropping and minimal contrast enhancement. S protein (red) and M protein (green) are seen in two middle lanes. S protein tends to aggregate at very high concentrations (Fig. S2) resulting in smeared signal above 250 kD. S protein cleavage product is seen at 75 kD however the band is better visible when imaging channels are shown separately (Fig. S6). Protein size standards are described in “Methods” and are seen in leftmost and rightmost lanes. All size standard bands are also annotated on the left.

