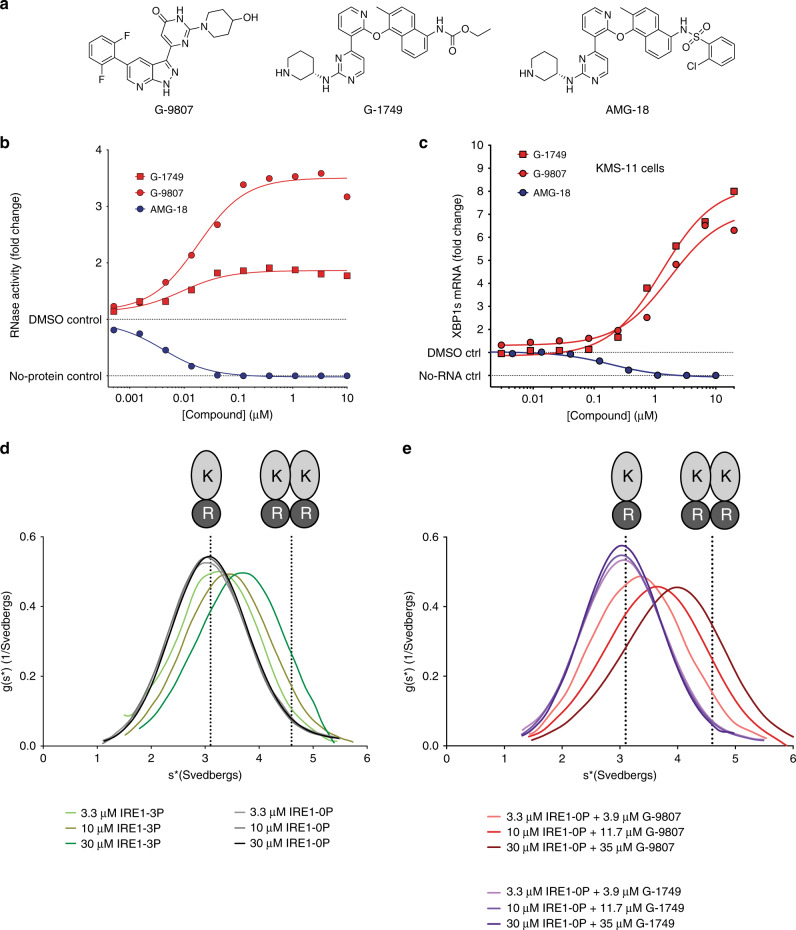
Fig. 1. Characterization of IRE1 kinase inhibitors.
a Chemical structures of IRE1 kinase (K) inhibitors. b IRE1 RNase (R) activity in the presence of compounds in panel a. RNA cleavage was measured by a kinetic fluorescence assay using an XBP1-like RNA hairpin substrate and IRE1 LKR construct (Q470-L977). Background from the no-protein control was subtracted from signal before calculating fold change. Source data are provided as a Source Data file. Data are presented as the mean for measurements from two independent experiments (n = 2). c RNA levels for IRE1 RNase product XBP1s measured by bDNA assay of lysates from KMS-11 cells treated with compounds for 4 h. Background from the no-RNA control was subtracted from signal before calculating fold change. Source data are provided as a Source Data file. Data are presented as the mean for measurements from two independent experiments (n = 2). d, e Analytical Ultracentrifugation sedimentation velocity (SV-AUC) experiments for (d), IRE1 LKR (Q470-L977) unphosphorylated and autophosphorylated and (e), IRE1 LKR unphosphorylated in the presence of slight excess G-9807 and G-1749. Calculated sedimentation coefficients for IRE1 monomer (3.1 svedbergs) and dimer (4.6 svedbergs) are highlighted by dotted lines. Source data are provided as a Source Data file.

