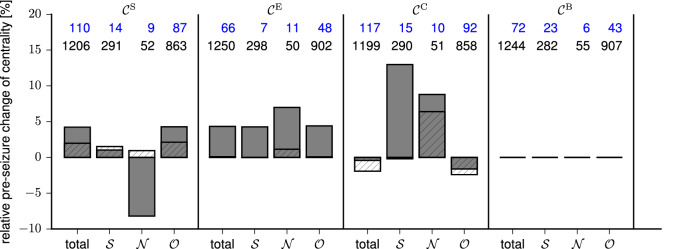
Figure 1.
Relative pre-seizure change of centrality values of nodes in the different modules. Non-hatched/hatched bars represent median values over predictive/non-predictive nodes (median pre-seizure centrality values referenced against median centrality values from seizure-free periods). Blue/black numbers on top represent the number of predictive/non-predictive nodes in each module ( strength centrality; betweenness centrality; closeness centrality; eigenvector centrality; “total” refers to the sum of these nodes). As betweenness centrality often yields values of 0, calculating a relative difference is not always possible, therefore we refer to the median absolute value which here amounts to 0.005 independent of the module (SOZ: , neighbours: , others: ).

