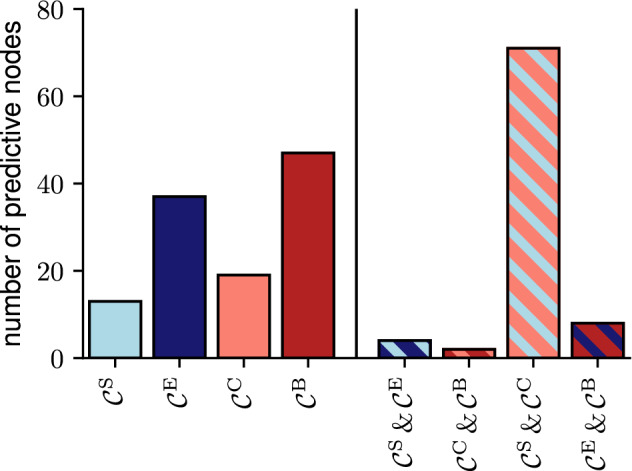
Figure 2.

Predictive nodes as identified with only respective centralities or combinations of such. For example, there are 13 nodes identified as predictive with , that are not identified as predictive with the other three centralities, and 4 nodes identified as predictive with and , that are not identified as predictive with the other two centralities. Different colours indicate different centralities (light blue: strength centrality ; dark blue: eigenvector centrality ; light red: closeness centrality ; dark red: betweenness centrality ). Centrality indices considering local/global aspects of the evolving epileptic brain network are depicted in light/dark colour respectively, while strength-/path-based centrality indices are depicted in blue/red. Hatched bars indicate a combination of the respective centralities (see colours above).
