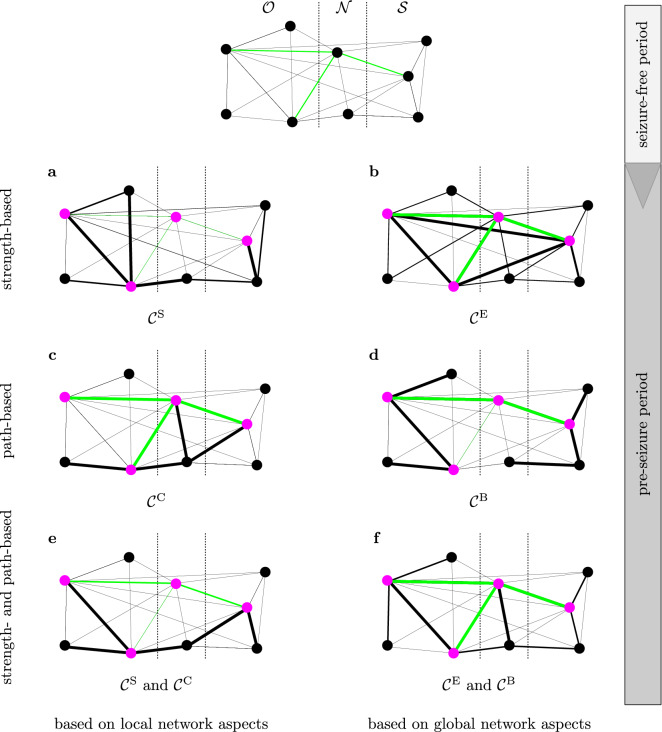
Figure 3.
Scenarios for the pre-seizure reconfiguration of the evolving epileptic brain network. Schematic of the network divided into the three functional modules (others , neighbours , SOZ ; separated by dashed lines). The different sub-figures (a–f) represent how the network during the seizure-free period (top) would change prior to seizures if the pink nodes were deemed predictive with the respective local and global interaction-strength-based and path-based centrality indices or combinations thereof (note that different centrality indices generally identified different nodes as predictive; we here restrict ourselves to just a few nodes to simplify visualisation). The networks can be assumed to be fully connected, however, for the purpose of visualisation, edges that remain unchanged during seizure-free and pre-seizure periods are not shown. Shortest paths identified in the seizure-free period (examples) are marked green. The thickness of an edge represents its edge weight: the thicker an edge the shorter the path traversing the edge or the stronger the connection between nodes. (: strength centrality; eigenvector centrality; closeness centrality; : betweenness centrality).

