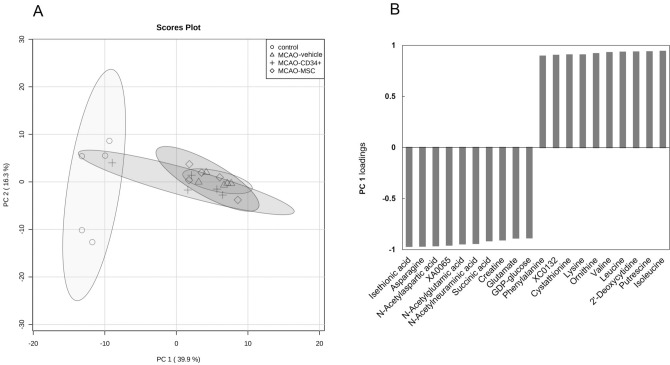
Figure 2.
Principal component analysis of cerebral metabolomic changes 72 h after MCAO vs no surgery. CE-TOF MS data for 151 detected metabolites were subjected to principal component analysis after being split into four groups. (A) Score plot showing that the groups were well divided between the control (circle) and MCAO groups, excluding one outlier in the MCAO-CD34+ cell group (cross), according to the variation of principal component (PC) 1 (X-axis). (B) PC1 loading column plot of the top 20 metabolites. The listed metabolites strongly contributed to PC1, and vertical gray bars are distances in multivariate space between the average metabolite vectors for each group.

