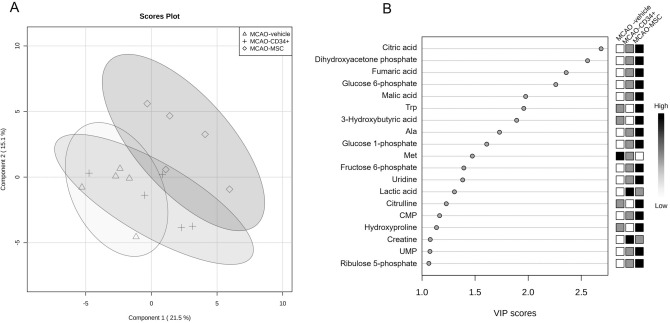
Figure 4.
Multivariate analysis of cerebral metabolomic changes among the MCAO groups. Concentration data for 79 metabolites detected among the three MCAO groups were subjected to partial least-squares discriminant analysis (PLS-DA). The score plot illustrates the difference between the MCAO-vehicle group (triangle) and the MCAO-MSC group (diamond) (A). Variable importance in the projection (VIP) scores > 1 among the three MCAO groups were extracted and are shown in a score plot (B).

